The Maya lands have seen the complex collapse of a great civilization (as the poet sang, "as things fell apart, nobody paid much attention"); invasions, plagues and enslavement on a scale which horrified some of the perpetrators; a violent millenarian movement which inspired a decades-long social war; and, in my life time, death squads, death squads and many, many more death squads. Thus is only makes sense that "the Maya apocalypse" refers to an idea which was made up in the late 20th United States, and has no relationship to anything the classic Maya thought.
![]() |
El Castillo of Xunantunich offers its congratulations on the completion of the last b'ak'tun, and best wishes for the 14th. Now, would anyone like to play ball, and make it interesting? |
(I still think we should have put up a stele on the National Mall to mark today.)
Posted by crshalizi at December 21, 2012 15:00 | permanent link
Attention conservation notice: Boasting about my student's just-completed doctoral dissertation. Over 2500 words extolling new statistical methods, plus mathematical symbols and ugly computer graphics, without any actual mathematical content, or even enough detail to let others in the field judge the results.
On Monday, my student Georg
M. Goerg, last seen here leading Skynet to declare war on
humanity at his dissertation
proposal, defeated
the snake — that
is, defended his thesis:
If you want to predict a spatio-temporal process, your best bet is to come up with an appropriately-detailed model of its dynamics, solve the model, estimate its parameters, and extrapolate it forward. Unfortunately, this is Real Science, and I gave up real science because it is hard. Coming up with a good mechanistic model of fluid flow, or combustion, or (have mercy) how the metabolic activity of computing neurons translates into blood flow and so into fMRI signals, is the sort of undertaking which could easily go on for years (or a century), and burning one graduate student per data set is wasteful. It would be nice to have a more automatic technique, which learns the dynamics from the data; at least, some representation of the dynamics. (We know this can be done for non-spatial dynamics.)
One might ignore the fact that the dynamics are spread out over space, and turn to modern time series methods. But this is not a good idea; even if the spatial extent is very modest, one is quickly dealing with very high-dimensional data, and the curse of dimensionality becomes crushing. Treating every spatial location as its own time series, and ignoring spatial dependence, is equally dubious. Now, just as there are unprincipled parametric statistical models of time series (ARMA et al.), there are unprincipled parametric statistical models of spatio-temporal data, but these offend me aesthetically, much as ARMA-mongering does. (I would sharply distinguish between these models, and parametric stochastic models which try to represent actual mechanisms.)
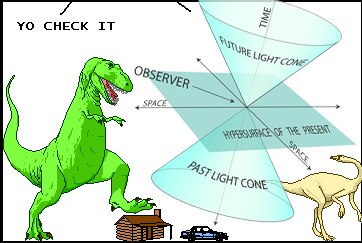
What Georg worked with in his thesis is the idea that, while spatial dependence matters, in spatio-temporal systems, it's generally not the case that every part of space-time depends on every other part of space-time. Suppose we want to predict what will happen at a particular point \( \vec{r} \) at a particular time \( t \). If influence can only propagate through the process at a finite speed \( c \), then recent events elsewhere can only matter if they are nearby spatially; more remote events could still be relevant even if further away. In symbols, what occured at another point-instant \( \vec{s},u \) could influence what happens at \( \vec{r},t \) only if \( \|\vec{s}-\vec{r}\| \leq c(t-u) \). Call this region of space-time the past cone of our favorite point-instant. Likewise, what happens at our point-instant can only influence those point-instants in its future cone, those where \( \|\vec{s}-\vec{r}\| \leq c(u-t) \).
I realize that such verbal-algebraic definitions are harder to follow than pictures, so I have prepared one. Take it away, T. rex:
Of course the whole idea is ripped off from special relativity, and so has to apply when the data are measured at a high enough time resolution, but we don't really need that. So long as there is some finite speed of propagation, we can use that to define past and future cones0. The very nice consequence is that conditioning on the past cone screens off what happens at \( \vec{r}, t \) from what happens in the rest of space-time. This means that instead of having to predict the future of the whole spatial configuration from the past of the whole spatial configuration, we just need to predict the future at each point from its past cone. We've traded a single huge-dimensional problem for a lot of much-lower-dimensional problems, which is a big gain.
When we want to actually do this prediction at a given point, we want to
know the distribution of the configuration in the future cone conditional on
the contents of the past cone. Call this the "predictive distribution" for
short. At this point, we could apply whatever predictive method we want.
There is however one which has a nice connection to the idea of reconstructing
the dynamics from the observed behavior. Suppose we had access to
an Oracle
which could tell us when two past-cone configurations would lead to the same
predictive distribution. We would then, if we were not idiots, group together
pasts which led to the same predictive distribution, and just remember, at each
point-instant, which predictive distribution equivalence class we're dealing
with. (We would pool data about actual futures within a class, and not across
classes.) The class labels would be the minimal sufficient statistic for
predicting the future. Since "predictive distribution equivalence class" is a
mouthful, we'll call these predictive states,
or, following
the literature, causal states. Every point-instant in
space-time gets its own predictive state,
with nice strong Markov
properties, and exactly the sort of screening-off you'd expect from a causal
model, so the latter name isn't even a total stretch1.
Since we do not have an Oracle, we try to approximate one, by building our
own equivalence classes among histories. This amounts to clustering past cone
configurations, based not on whether the configurations look similar,
but whether they lead to similar predictive consequences. (We replace
the original geometry in configuration-space by a new geometry in the space of
predictive distributions, and cluster there.) In the older papers Georg
mentioned in his abstract, this clustering was done in comparatively crude ways
that only worked with discrete data, but it was always clear that was just a
limitation of the statistical implementation, not the underlying mathematics.
One could, and people
like Jänicke et
al. did, just quantize continuous data, but we wanted to avoid taking
such a step.
For the original LICORS algorithm, Georg cracked the problem by using modern
idea for high-dimensional testing. Basically, if we assume that the predictive
state space isn't too rich, as we observe the process for longer and longer we
gain more and more information about every configuration's predictive
consequences, and grouping them together on the basis
of statistical powerful hypothesis tests yields a closer
and closer approximation to the true predictive states and their predictive
distributions. (I won't go into details here; read the paper, or the
dissertation.)
This is basically a "hard" clustering, and experience suggests that one
often gets better predictive performance from "soft", probabilistic
clustering2. This is
what "mixed LICORS" does --- it alternates between assigning each history to a
fractional share in different predictive states, and re-estimating the states'
predictive distributions. As is usual with non-parametric EM algorithms,
proving anything is pretty hopeless, but it definitely works quite well.
To see how well, we made up a little spatio-temporal stochastic process,
with just one spatial dimension. The observable process is non-Gaussian,
non-Markovian, heteroskedastic, and, in these realizations, non-stationary.
There is a latent state process, and, given the latent state, the observable
process is conditionally Gaussian, with a variance of 1. (I won't give the
exact specification, you can find it in the thesis.) Because there is only one
spatial dimension, we can depict the whole of space and time in one picture,
viewing the realization sub specie aeternitatis. Here is one such
Spinoza's-eye-view of a particular realization, with time unrolling horizontally from left to right:
Since this is a simulation, we can work out the true predictive
distribution. In fact, we rigged the simulation so that the true predictive
distribution is always homoskedastic and Gaussian, and can be labeled
by the predictive mean. For that realization, it looks like this:
LICORS of course doesn't know this; it doesn't know about the latent state
process, or the parametric form of the model, or even that there is such a
thing as a Gaussian distribution. All it gets is one realization of the
observed process. Nonetheless, it goes ahead and constructs its own predictive
states3. When we label those by their
conditional means (even though we're really making distributional forecasts),
we get this:
Qualitatively, this looks like we're doing a pretty good job of matching
both the predictions and the spatio-temporal structure, even features which are
really not obvious in the surface data. Quantitatively, we can compare how
we're doing to other prediction methods:
In other words, hard LICORS predicts really well, starting from no
knowledge of the dynamics, and mixed LICORS (not shown in that figure; read the
dissertation!) is even stronger. Of course, this only works because the
measurement resolution, in both space and time, is fine enough that
there is a finite speed of propagation. If we reduced the
time-resolution enough, every point could potentially influence every other in
between each measurement, and the light-cone approach delivers no advantage.
(At the other extreme, if there really is no spatial propagation of influence,
the cones reduce to the histories of isolated points.) A small amount of
un-accounted-for long-range connections doesn't seem to present large problems;
being precise about that would be nice. So would implementing
the theoretical possibility
of replacing space with an arbitrary, but known, network.
Once we have a predictive state for each point-instant, we can calculate how
many bits of information about the past cone configuration is needed to specify
the predictive state. This is the local statistical complexity, which we can
use for automatic filtering and pattern discovery. I wrote about
that idea
lo these many years ago, but Georg has some very nice
results in his thesis on empirical applications of the notion, not
just the abstract models of pattern formation I talked about. We can also use
the predictive-state model to generate a new random field, which should have
the same statistical properties as the original data, i.e., we can do a
model-based bootstrap for spatio-temporal data, but that's really another story
for another time.
Clearly, Georg no longer has anything to learn from me, so it's time for him
to leave the ivory tower, and go seek his fortune in Manhattan. I am very
proud; congratulations, Dr. Goerg!
0: When I mentioned this idea in
Lyon in 2003, Prof. Vincenzo Capasso informed me that
Kolmogorov used just such a construction in a 1938 paper modeling the
crystallization of
metals, apparently
introducing the term "causal cone". Whether Kolmogorov drew the analogy with
relativity, I don't know. ^
[1]: One discovery of
this construction for time series was that of Crutchfield and Young, just
linked to; similar ideas were expressed earlier by Peter Grassberger. Later
independent discoveries include that
of Jaeger,
of Littman, Sutton
and Singh, and of Langford,
Salakhutdinov and Zhang. The most comprehensive set of results for
one-dimensional stochastic processes is actually that
of Knight from
1975. The earliest is from Wesley Salmon, in
his Statistical
Explanation and Statistical Relevance (1971).
The information bottleneck
is closely related, as are
some of Lauritzen's ideas
about sufficient statistics and
prediction. I have probably missed other
incarnations. ^
[2]: Obviously, that
account of how mixed LICORS came about is a [3]: LICORS needs to know the
speed of propagation, \( c \), and how far the past and future cones should
extend in time. If there are no substantive grounds for choosing these control
settings, these can be set by cross-validation. There's not a lot of theory to
back that up, but in practice it works really well. Getting some theory of
cross-validation for this setting would be great. ^
Mean squared errors of different models, evaluated
on independent realizations of the same process. "Mean per row" learns a
different constant for each spatial location. The AR(p) models, of various
orders, learn a separate linear autoregressive model for each spatial location.
The VAR(p) models learn vector autoregressions for the whole spatial
configuration, with Lasso penalties as
in Song and Bickel. The "truth"
is what an Oracle which knew the underlying model could achieve; the final
columns show various tweaks to the LICORS algorithm.
lie rational
reconstruction. It really grew out of Georg's using an analogy with mixture
models when trying to explain predictive states to neuroscientists. In a
mixture model for \( Y \), we write
\[
\Pr(Y=y) = \sum_{s}{\Pr(S=s)\Pr(Y=y|S=s)}
\]
where the sum is over the components or profiles or extremal distributions in
the mixture. Conditioning on another variable, say \( X \)
\[
Pr(Y=y|X=x) = \sum_{s}{\Pr(S=s|X=x)\Pr(Y=y|S=s,X=x)}
\]
which is clearly going to be even more of a mess than the marginal
distribution. Unless, that is, \( \Pr(S=s|X=x) \) collapses into a delta
function, which will happen when \( S \) is actually a statistic calculable
from \( X \). The predictive states are then the profiles in a mixture model
optimized for prediction. ^
Posted by crshalizi at December 20, 2012 22:30 | permanent link
The Santa Fe Institute's complex systems summer school and graduate workshop in computational social science are taking applications now. Both are outstanding ways of learning about complexity, not just from really good instructors but also from first-rate fellow students, in a setting which could hardly be nicer. (Honestly compels me to note that the summer school has inexplicably tapped a someone with no relevant credentials to teach machine learning and statistics...)
Posted by crshalizi at December 10, 2012 21:20 | permanent link
I know I have been very slow in posting about what I read in October and November. Have some sphinxes:
Posted by crshalizi at December 09, 2012 21:15 | permanent link
Attention conservation notice: Advertisements for myself and my co-authors. If these were of interest, you'd probably already have seen them on arxiv.
I don't seem to have publicized new papers at all this year. Except for the first, they're all working their way through the peer-review system.
20 December: more on Georg's thesis work.
Self-Centered; Enigmas of Chance; Networks; Complexity; The Dismal Science; Learned Folly
Posted by crshalizi at December 06, 2012 21:05 | permanent link
Attention conservation notice: Self-promotion of an academic talk, based on a year-old paper, on arcane theoretical aspects of statistical network models.
Since everybody in my professional world seems to be going to Lake Tahoe, I am, naturally, going to Philadelphia, where I'll talk about our paper on exponential-family random graph models:
*: I don't know whether to be pleased or faintly depressed that, 15+ years later, The Onion is still selling its "Your favorite band sucks" t-shirt.
Posted by crshalizi at December 02, 2012 21:30 | permanent link
Attention conservation notice: I have no taste.
Books to Read While the Algae Grow in Your Fur; Scientifiction and Fantastica; The Progressive Forces; Philosophy; Writing for Antiquity; Linkage
Posted by crshalizi at November 30, 2012 23:59 | permanent link
Attention conservation notice: Complacent navel-gazing about teaching statistics to undergraduates at a very un-representative university. Written back in May, not posted due to laziness.
Overall, I think this went tolerably but not perfectly. The content was improved and is near (but not at) a local optimum. I've also got a better sense than last year of how much they're learning, and I think the homework is helping them learn. But the course could definitely do more to move them towards doing data analysis, as opposed to answering homework questions.
It was a substantially bigger class than last time (88 students vs. 63), and this led to some real issues. The lecture room was fine, but office hours were over-crowded, the stream of e-mail from student seemed unending, and, worst of all, there simply wasn't enough TA time available for grading. (88 weekly assignments of serious data analysis is a lot to grade.) Everything did get graded eventually, but not as fast as it should have been. From the number of students registered for the fall course in regression which is ADA's pre-requisite, I can expect about as many again in 2013, or a few less. This is about twice as many students as I'd like to see in it.
Speaking of grading, I had to completely re-do the assignments, since solutions from last year were circulating1 --- and I did not put the new solutions on-line. This was a big chunk of work I was not anticipating, but at least now I have two sets of problems for the future.
In terms of actual content, I cut nothing major, but, by eliminating exam review sessions, etc., squeezed in some extra stuff: a reminder lecture on multivariate distributions, smooth tests and relative densities, time series, and more on estimating causal effects. I am relatively happy with the over-all content, though less so with the organization. In particular I wonder about devoting the very first part of the course to regression with one input variable, as a really elementary way to introduce fundamental concepts (smoothing, kernels, splines, generalization, cross-validation, bootstrap, specification checking), and only then go to regression with multiple inputs. I worry, however, that this would be coddling them.
The "quality control samples" were eye-opening. Some students found them nerve-wracking, which was counterproductive; but lots of them also gave every sign of being candid. What I found most surprising was how many of them (a third? more?) were taking ADA because they had been funneled into it by major other than statistics, often one of CMU's several larval-quant programs. (I'm not sure how those took my plugging Red Plenty in class while explaining Lagrange multipliers.) Their self-de-motivating question was not "Is this going to be on the exam?", but rather, "Is this going to come up in interviews?". If I were a better teacher I'd work more at reaching these students.
Week-to-week, the quality control samples were very helpful for figuring out what students actually grasped, and, even more, how their thinking went astray (when it did). In particular, there turned out to be much more variation than I'd anticipated in readiness to apply material they had already learned in a new context — the "but that's from chapter 7 and this is chapter 12" problem, or even the "but that's from introduction to statistical inference, or matrices and linear transformations, which I took a year ago" problem. I am not sure if I should provide more cues, or if, again, that would be coddling.
These facts about motivation and preparation don't please me, exactly, but at least for right now these seem like constraints I have to (and can) work within.
I will certainly use the quality-control samples again in 2013, but I may take fewer each week, and make it clearer to the students that they're not being graded.
Some specifics:
Finally, if students again complain that the class makes it harder for them to take seriously what they hear in economics or psychology or the like, remember not to laugh maniacally, or use expressions like "Victory is mine!" Rather, maintain a sober, thoughtful, benevolent, and above all sane expression, and talk solemnly about the great prospects for using good statistical methods to solve real-world problems.
[1]: One advantage to putting bad jokes in your solutions is that it becomes pretty obvious when someone is parroting them back to you.
Posted by crshalizi at November 13, 2012 18:42 | permanent link
It's that time again:
Fuller details on the class homepage, including a detailed (but subject to change) list of topics, and links to the compiled course notes. I'll post updates here to the notes for specific lectures and assignments, like last time.
This is the same course I taught the last two springs, again at ninety-odd students from over a dozen majors.
Posted by crshalizi at November 12, 2012 15:30 | permanent link
Available options for the final group project in statistical computing.
(Some of these projects are ripped off from Vince Vu, with permission.)
Posted by crshalizi at November 12, 2012 11:30 | permanent link
Homework 10: in which we refine our web-crawler from lab, by way of further working with regular expressions, and improving our estimates of page-rank.
(This assignment ripped off from Vince Vu, with permission.)
Posted by crshalizi at November 09, 2012 11:30 | permanent link
Lab 9: In which we build a little web-crawler to calculate page-rank (the hard way), so as to practice working with text, regular expressions, and Markov chains. Supplied code, which may or may not contain deliberate bugs.
(This assignment ripped off from Vince Vu, with permission.)
Posted by crshalizi at November 09, 2012 10:30 | permanent link
Lectures 20 and 21: Regular expressions. Why we need ways of describing patterns of strings, and not just specific strings. The syntax and semantics of regular expressions: constants, concatenation, alternation, repetition. Back-references and capture groups. Splitting on regular expressions. grep and grepl for finding matches. regexpr and gregexpr for finding matches, regmatches for extracting the matching substrings. regexec for capture groups. Examples of multi-stage processing with regular expressions. Examples of substitutions with regmatches, sub and gsub. Things you cannot do with regular expressions.
Examples: Lincoln's 2nd inaugural address; baking brownies with Ms. Alice B. Tolkas; extracting earthquake information from data files.
Posted by crshalizi at November 09, 2012 09:30 | permanent link
Attention conservation notice: Only of interest if you (1) care about statistical models of networks, and (2) will be in Pittsburgh on Monday.
Constant readers will recall that I have often in the past boosted Mark Handcock's work on comparing distributions, measuring trends in inequality, doing sensible inference with power laws, and modeling network structure statistically. I am thus extremely happy to announce next week's seminar:
As always, the talk is free and open to the public.
Posted by crshalizi at November 08, 2012 12:15 | permanent link
Lecture 19: Text as data. Overview of the character data type, and of strings. Basic string operations: extracting and replacing substrings; split strings into character vectors; assembling character vectors into strings. The need for a way of computing with text patterns, and not just constants.
(This lecture ripped off from Vince Vu, with permission.)
Posted by crshalizi at November 05, 2012 10:30 | permanent link
In which we continue our inquiry into the spread of tetracycline, along the way practicing more optimization, learning about robust regression, and figuring out how uncertain a point estimate is by looking at how well we can minimize the error function.
Posted by crshalizi at November 02, 2012 11:30 | permanent link
In which we examine the diffusion of innovations, by way of fitting models through minimizing error, transforming data from one representation to another, and experiencing the warm inner glow of a well-crafted initial estimate.
Assignment, ckm.csv data set.
Posted by crshalizi at November 02, 2012 10:30 | permanent link
Attention conservation notice: I have no taste.
Manual trackback: John Myles White
Update, 11 December 2012: small typo fixes and wording improvements.
Books to Read While the Algae Grow in Your Fur; Scientifiction and Fantastica; The Dismal Science; Physics; Minds, Brains, and Neurons; Enigmas of Chance; Commit a Social Science; The Collective Use and Evolution of Concepts; Cthulhiana
Posted by crshalizi at October 31, 2012 23:59 | permanent link
Lecture 18: Stochastic, Constrained, and Penalized Optimization. Difficulties of optimizing statistical functions when the data is large. Sampling as an alternative to averaging over the whole data. Stochastic gradient descent and stochastic Newton's method as an application of sampling. Simulated annealing to escape local minima. Constrained optimization: an example of why constraints matter. The method of Lagrange multipliers for equality constraints. Lagrange multipliers as shadow prices, indicating how much a marginal weakening of the constraint would improve the optimum. Inequality constraints and their Lagrange multipliers. Mathematical programming. Barrier methods for inequality constraints. The correspondence between constrained and penalized optimization.
Optional reading 1: Léon Bottou and Olivier Bosquet, "The Tradeoffs of Large Scale Learning"
Optional reading 2: Francis Spufford, Red Plenty (cf.); Herbert Simon, The Sciences of the Artificial, especially chapters 5 and 8.
Posted by crshalizi at October 31, 2012 10:30 | permanent link
Lecture 17: Deterministic, Unconstrained Optimization. The trade-off of approximation versus time. Basics from calculus about minima. The gradient-descent method, its pros and cons. Taylor expansion as the motivation for Newton's method; Newton's method as gradient descent with adaptive step-size; pros and cons. Coordinate descent instead of multivariate optimization. Nelder-Mead/simplex method for derivative-free optimization. Peculiarities of optimizing statistical functionals: don't bother optimizing much within the margin of error; asymptotic calculations of said margin, using Taylor expansion and the rules for adding and multiplying variances. Illustrations with optim.
Optional reading: Francis Spufford, Red Plenty (cf.); Herbert Simon, The Sciences of the Artificial, especially chapters 5 and 8.
Posted by crshalizi at October 29, 2012 10:30 | permanent link
Homework 8: In which we read Moretti with Poisson and Metropolis.
Data: moretti.csv
Posted by crshalizi at October 26, 2012 11:30 | permanent link
Lab 7: In which we read Graphs, Maps, Trees to practice estimation, simulation, and transforming data from one representation to another.
Data: moretti.csv
Posted by crshalizi at October 26, 2012 10:30 | permanent link
Lecture 18: Combing multiple dependent random variables in a simulation; ordering the simulation to do the easy parts first. Markov chains as a particular example of doing the easy parts first. The Markov property. How to write a Markov chain simulator. Verifying that the simulator works by looking at conditional distributions. Variations on Markov models: hidden Markov models, interacting processes, continuous time, chains with complete connections. Asymptotics of Markov chains via linear algebra; the law of large numbers (ergodic theorem) for Markov chains: we can approximate expectations as soon as we can simulate.
The Monte Carlo principle for numerical integrals: write your integral as an expectation, take a sample. Examples. Importance sampling: draw from a distribution other than the one you really are want, then weight the sample values. Markov chain Monte Carlo for sampling from a distribution we do not completely know: the Metropolis algorithm. Bayesian inference via MCMC.
Readings: Handouts on Markov chains and Monte Carlo and on Markov chain Monte Carlo
Posted by crshalizi at October 24, 2012 10:30 | permanent link
Lecture 15: Why simulate? Generating random variables as first step. The built-in R commands: rnorm, runif, etc.; sample. Transforming uniformly-distributed random variables into other distributions: the quantile trick; the rejection method; illustration of the rejection method. Understanding pseudo-random number generators: irrational rotations; the Arnold cat map as a toy example of an unstable dynamical system; illustrations of the Arnold cat map. Controlling the random number seed.
Readings: Matloff, chapter 8; The R Cookbook, chapter 8
Posted by crshalizi at October 22, 2012 10:30 | permanent link
Attention conservation notice: Self-promotion, based on unpublished papers.
Both talks are free, but I don't know if you'd have to show university ID to get into the buildings.
"LICORS" is pronounced "liquors". "Consistency under Sampling of Exponential Random Graph Models" is pronounced "Really, all we wanted to do was prove that maximum likelihood works when the data is a big graph".
Posted by crshalizi at October 16, 2012 15:08 | permanent link
Attention conservation notice: Only interesting if you (1) care about dividing networks into cohesive sub-networks in a statistically principled manner, and (2) will be in Pittsburgh next Monday afternoon.
As someone who is deeply interested in community discovery, and has admired her work for many years, I am extra pleased to announce next week's speaker and her subject:
As always, the talk is free and open to the public.
Posted by crshalizi at October 16, 2012 15:00 | permanent link
Attention conservation notice: 2000+ words, and many equations, expounding a technical paper on statistical learning theory. Written up from a presentation at the CMU statistical learning group yesterday.
Our text for today:
I will depart slightly from its notation, in the direction of my own arbitrary whims.
Learning theory, like fairy tales, is a highly formulaic genre. Our version of "Once upon a time" is
We have a class of hypotheses \( H \), and observe IID draws \( X_1, X_2, \ldots X_n \), all with common distribution \( Q \). We want to pick a hypothesis such that \( \mathbb{E}_{Q}[L(h(X), f(X))] \) is small, where \( L \) is some loss function, and \( f(X) \) is what Nature actually does. This expected loss is called the risk of the hypothesis, \( R(h) \).
Notice that the risk is an expectation, calculated under the same distribution used to produce the training data \( X_1, \ldots X_n \). This is what licenses rather simple inductions from the training data to the testing data. Specifically, we get to say something about how quickly the in-sample risk \[ \hat{R}_n(h) \equiv \frac{1}{n}\sum_{i=1}^{n}{L(h(x_i),f(x_i))} \] converges to the true risk, i.e., to put probability bounds on \[ \left|\hat{R}_n(h) - R(h)\right| \] For instance, if \( L \) is bounded to \( [0,1] \) , we could use Hoeffding's inequality here, saying \[ \Pr{\left( \left|\hat{R}_n(h) - R(h)\right|>\epsilon\right)} \leq 2e^{-2 n \epsilon^2} \] Of course, such deviation bounds are finite-sample rather than asymptotic results, they hold whether or not the model specification \( H \) matches the data-generating process, and they are even free of the distribution \( Q \). (Much of the appeal of this paper comes from dealing with unbounded losses, but I'll come to that.)
The IID-from-the-same-source assumption also lets us control the whole empirical process of risks, and especially its supremum, \[ \sup_{h\in H}{\left|\hat{R}_n(h) - R(h)\right|} \] Controlling the latter is what lets us place generalization error bounds on hypotheses we have chosen to fit the training data.
(It is tedious to have to keep writing \( L(h(X),f(X)) \), so we abbreviate it \( L_h(x) \). Thus \( R(h) = \mathbb{E}[L_h(X)] \) , and similarly for the in-sample or empirical risk.)
This is all very well, but the assumption that the testing data are actually going to come from exactly the same distribution as the training data is one of the less believable fairy-tale motifs. A small — a very small — step towards realism is to say that while the training data were generated iidly by \( Q \), the future testing data will be generated iidly by \( P \). Thus what we want to control is \( \mathbb{E}_{P}[L(h(X),f(X))] \), without actually having samples from \( P \).
This step can be rationalized in several different ways. One is that the distribution of the data is actually changing. Another is that our training examples were somehow generated in a biased manner, or selected as training examples in a biased way. Be that as it may, we want to somehow adjust the training data which we have, to make it look more like it came from \( P \) than its actual source \( Q \).
A very natural way to accomplish this is to weight the samples. Writing \( p \) and \( q \) for the probability density functions that go with the distributions, the importance weight at \( x \) is \[ w(x) \equiv \frac{p(x)}{q(x)} \]
Now notice that for any function \( g \) , \[ \mathbb{E}_{Q}[w(X) g(X)] = \int{w(x) g(x) q(x) dx} = \int{g(x) p(x) dx} = \mathbb{E}_{P}[g(X)] \] so taking weighted expectations under \( Q \) is the same as taking unweighted expectations under \( P \). By the law of large numbers, then, \[ \frac{1}{n}\sum_{i=1}^{n}{w(x_i) g(x_i)} \rightarrow \mathbb{E}_{P}[g(X)] \] even though the \( x_i \) were generated under \( Q \), not under \( P \). Similarly, we could get deviation bounds and generalization-error bounds for \( P \) from \( Q \)-generated data.
(At this point, those of you who have taken measure theory might find this idea of changing integrals under one measure to integrals under another rings some bells. The importance weight function \( w(x) \) is indeed just the Radon-Nikodym derivative of \( P \) with respect to \( Q \), \( w(x) = \frac{dP}{dQ}(x) \) . The weight function \( w \) is thus itself a probability density. Read your measure theory!)
At this point, the naive reader will expect that we'll talk about how to estimate the importance weighting function \( w \) . In fact, following Cortes et al., I'll assume that it is handed to us by the Good Fairy of Covariate Shift Adaptation. This is for two reasons. First, estimating \( w \) is just as hard as estimating a probability density (see previous parenthetical paragraph), which is to say rather hard indeed in high dimensions. Second, even if we assume that \( w \) is just handed to us, there are still interesting problems to deal with.
The easy case, which has gotten a fair amount of attention in the literature on covariate shift but does not detain Cortes & c. very long, is when the weights are bounded: \[ \sup_{x} {w(x)} = M < \infty \] Under this assumption, since we're still assuming a loss function bounded in \( [0,1] \) , the weighted loss \( w(x) L_h(x) \) is bounded by \( M \) . Another turn of Hoeffding's inequality then says \[ \Pr{\left(\left|\frac{1}{n}\sum_{i=1}^{n}{w(x_i)L_h(x_i)} - R(h) \right| > \epsilon \right)} \leq 2 e^{-2n\epsilon^2/M^2} \]
Now we can go through all the usual steps, like bounding the effective number of different functions to control the maximum deviation over all of \( H \), etc., etc.
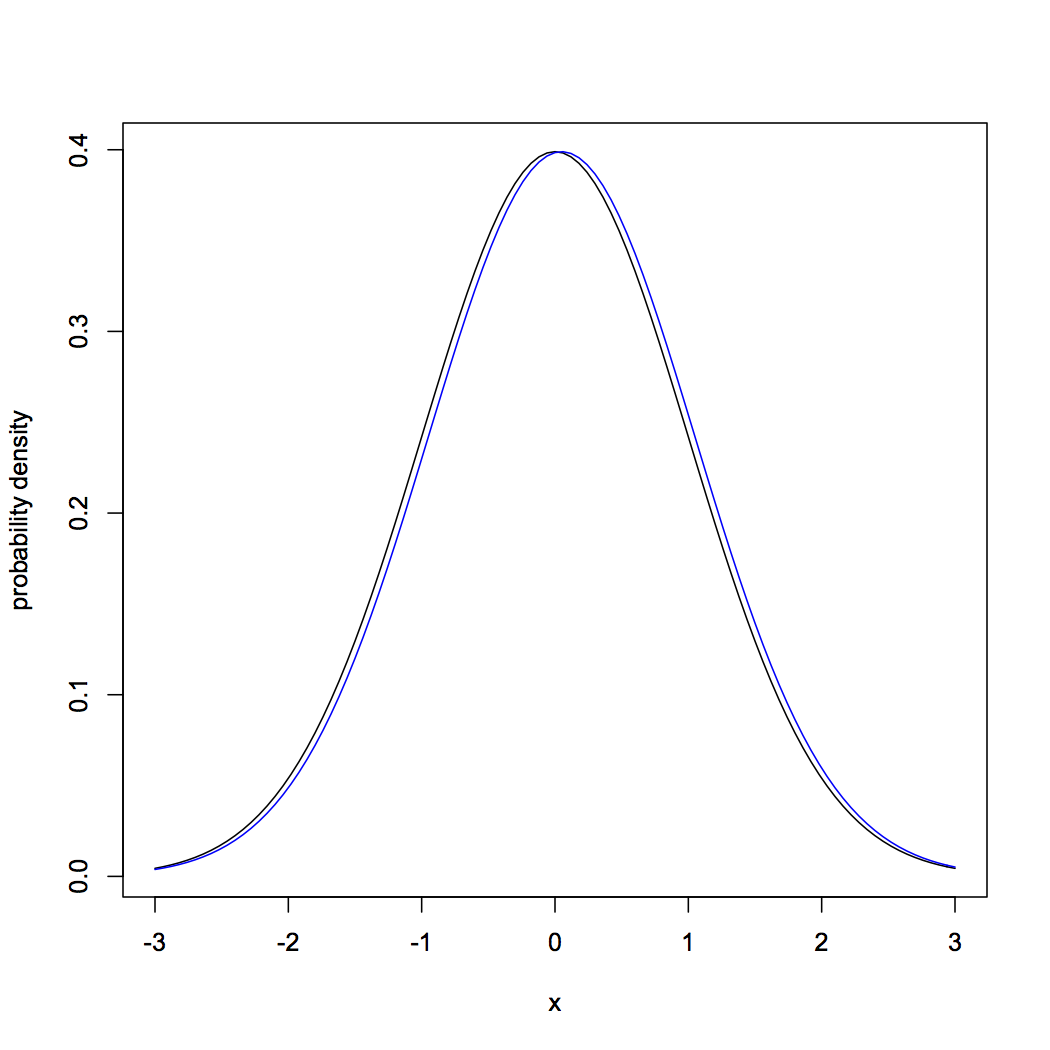
The difficulty is that the assumption of bounded weights is so incredibly restrictive as to be useless. Consider, to be concrete, two Gaussians with the same variance, and slightly shifted means:
![]() |
curve(dnorm(x,0,1),from=-3,to=3,ylab="probability density") curve(dnorm(x,0.05,1),col="blue",add=TRUE) |
![]() |
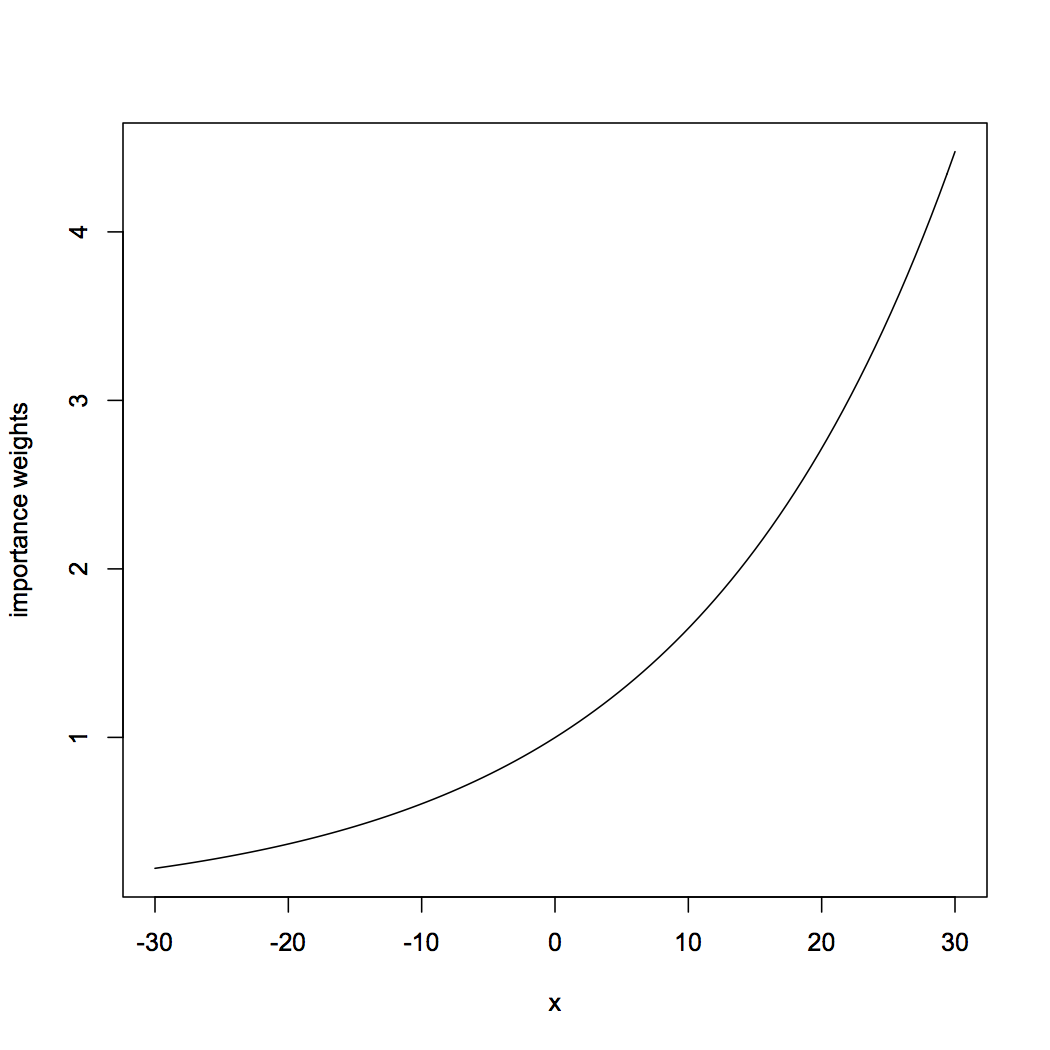
curve(dnorm(x,0.05,1)/dnorm(x,0,1),from=-30,to=30,ylab="importance weights") |
A little algebra will convince you that in this case the weight will grow without bound as \( x \rightarrow \infty \) .
One reaction would be to throw up your hands in despair, and say that nothing can be done in this situation. A little more thought, however, suggests that everything should not be hopeless here. The really huge weights, which cause the big problems, only occur for parts of the sample space which are really improbable under both distributions. It's true that the largest weight is infinite, but the average weight is quite finite, whether we compute "average" under \( Q \) or \( P \). The weights even have a finite second moment, which tells us that the central limit theorem applies. Might we not be able to use this?
At this point, the action in the Cortes et al. paper shifts to the supplemental material. As is so often the case, this is a paper in itself. As is very rarely the case, it is another good paper. (Indeed it may be more widely applicable than the main paper!)
Suppose now that we have only one distribution, but our loss-function is unbounded. It would be asking a lot to be able to control \[ \sup_{h \in H}{\left|R(h) - \hat{R}_n(h) \right|} \] when both the sample means and the true expectations could get arbitrarily large. We might, however, hope to control \[ \sup_{h \in H}{\frac{R(h) - \hat{R}_n(h)}{\sqrt{\mathbb{E}[L^2_h(X)]}}} \] since these are, to put in terms of baby stats., just Z-scores. Let's introduce the simplifying notation \[ V_h \equiv \sqrt{\mathbb{E}[L^2_h(X)]} \] for these second moments. We assume that \( V_h < \infty \) for all \( h \) , but we do not (for right now) assume that they are uniformly bounded.
The first step in controlling the fluctuations in the expected loss is to control the fluctuations in the probabilities that the loss exceeds any given threshold (Theorem 5): \[ \Pr{\left( \sup_{h\in H}{\frac{R(h) - \hat{R}_n(h)}{V_h}} > \epsilon\sqrt{2-\log{\epsilon}} \right)} \leq \Pr{\left( \sup_{h \in H, t \in \mathbb{R}}{\frac{\Pr{(L_h > t)} - \widehat{\mathrm{Pr}}(L_h > t)}{\sqrt{\Pr{(L_h > t)}}}} > \epsilon \right)} \] where \( \widehat{\mathrm{Pr}} \) is empirical probability. This is shown through combining the representation \[ \mathbb{E}{L_h(X)} = \int_{0}^{\infty}{\Pr{(L_h(X) > t)} dt} ~, \] valid for any non-negative function, with sheer trickery involving the Cauchy-Schwarz inequality. (The point of writing \( \epsilon\sqrt{2-\log{\epsilon}} \) on the left-hand side is to make the right-hand side come out simple; we'll come back to this.)
Now, notice that \( \Pr{(L_h > t)} \) is the expected value of an indicator function, \( \mathbb{E}\left[\mathbb{1}_{L_h > t}(x) \right] \), and that the corresponding empirical probability is the sample mean of the same indicator function. Cortes et al. therefore appeal to a valuable but little-known result on the relative convergence of sample proportions to probabilities, due to Anthony and Shawe-Taylor (following Vapnik), which we may phrase as follows. Let \( C \) be a set of binary classifiers, and \( G_C(n) \) be the growth function of the class, the maximum number of classifications of \( n \) points which it can realize. Further, let \( S(c) \) be the mis-classification risk of \( c \in C \), and \( \hat{S}_n(c) \) its empirical counterpart. Then \[ \Pr{\left(\sup_{c \in C}{\frac{S(c) - \hat{S}_n(c)}{\sqrt{S(c)}}} > \epsilon \right)} \leq 4 G_C(2n)e^{-n\epsilon^2 /4} \]
If, as is usual, we define the growth function of a real-valued function class as the growth function of its level sets (i.e., the sets we can get by varying \( L_h(x) > t \) over \( t \) and \( h \) ), then we combine the previous results to get \[ \Pr{\left( \sup_{h\in H}{\frac{R(h) - \hat{R}_n(h)}{V_h}} > \epsilon\sqrt{2-\log{\epsilon}} \right)} \leq 4 G_H(2n) e^{-n\epsilon^2/4} \]
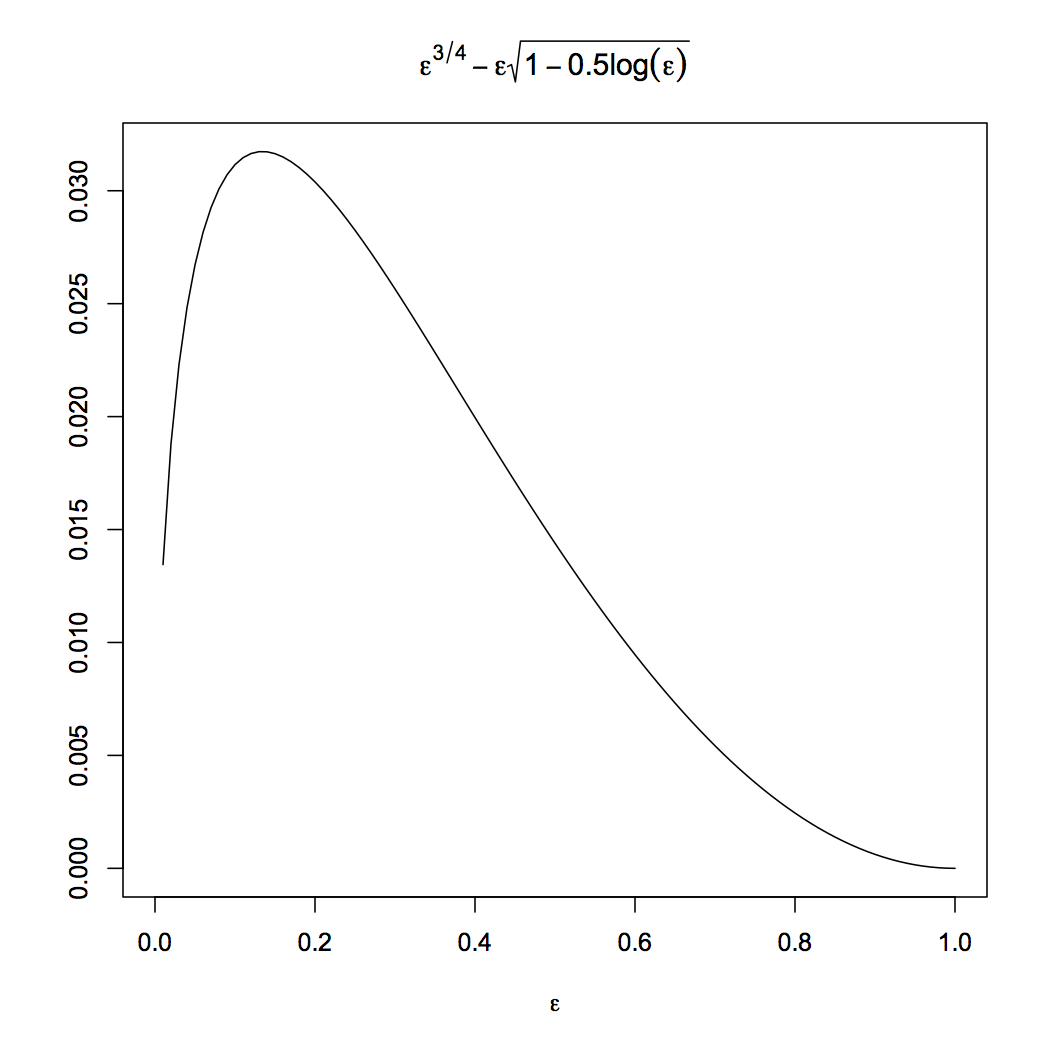
The appearance of \( \epsilon\sqrt{2-\log{\epsilon}} \) inside the probability is annoying; we would now like to shift messiness to the right-hand side of the inequality. This means setting \[ \delta = \epsilon\sqrt{2-\log{\epsilon}} \] and solving for \( \epsilon \) in terms of \( \delta \). This could actually be done in terms of the Lambert W function. Cortes et al., however, do not invoke the latter, but notice that, over the interval \( \epsilon \in [0,1] \), \[ \epsilon\sqrt{1-0.5\log{\epsilon}} \leq \epsilon^{3/4} \] but that no smaller power of \( \epsilon \) will do. (In the proof of their Corollary 1, read \( \epsilon^{\beta} \) instead of \( e^{\beta} \) throughout.) It's actually a remarkably good approximation:
![]() |
curve(x^0.75 - x*sqrt(1-0.5*log(x)),from=0,to=1, xlab=expression(epsilon), ylab="", main=expression(epsilon^{3/4} - epsilon*sqrt(1-0.5*log(epsilon)))) |
Thus we have \[ \Pr{\left( \sup_{h\in H}{\frac{R(h) - \hat{R}_n(h)}{V_h}} > \epsilon \right)} \leq 4 G_H(2n) e^{-n\epsilon^{8/3}/4^{5/3}} \] The growth function in turn can be bounded using the Pollard pseudo-dimension, as Cortes et al. do, but the important point is that it's only polynomial in \( n \) for well-behaved function classes. This is a very nice and important result for those of us who want to use learning theory in regression, or other areas where bounded loss functions are just unnatural.
Now let us return to importance weighting. Suppose once again that our real loss function is bounded between 0 and 1, but our weights are unbounded. We have \[ \Pr{\left( \sup_{h \in H}{\frac{R(h) - \frac{1}{n}\sum_{i=1}^{n}{w(x_i) L_h(x_i)}}{\sqrt{\mathbb{E}_{Q}[w^2(X)]}}} > \epsilon \right)} \leq 4 G_{H}(2n) e^{-n\epsilon^{8/3}/4^{5/3}} \] and go from there. The quantity \( \mathbb{E}_Q[w^2(X)] \), which controls how tight the generalization error bounds are, is, as they show in some detail, related to our old friend the second-order Renyi divergence. It is this quantity which is small for our two near-by Gaussians, even though the maximum importance weights are unbounded.
Cortes et al. go on to consider variations on the importance weights, which allow some bias in the estimation of \( P \)-risk in exchange for reduced variance; this is potentially important, but more than I feel like I have energy for. I will just close by recommending footnote 1 of the supplement to connoisseurs of academic venom.
Posted by crshalizi at October 16, 2012 14:15 | permanent link
Lecture 13: Abstraction as a way to make programming more friendly to human beings. Refactoring as a form of abstraction. The rectification of names. Consolidation of related values into objects. Extracting common operations. Defining general operations. Extended example with the jackknife.
Posted by crshalizi at October 15, 2012 10:30 | permanent link
Midterm Exam. There were 12 questions; each student got six, randomly divided between questions 1 or 2; questions 3--5 or 6--8; questions 9 or 11; and question 10 or 12. So for those playing along at home, it's only half as bad as it looks.
Posted by crshalizi at October 12, 2012 10:30 | permanent link
Lecture 12, Split/apply/combine II: using plyr. Abstracting the split/apply/combine pattern: using a single function to appropriately split up the input, apply the function, and combine the results, depending on the type of input and output data. Syntax details. Examples: standardizing measurements for regularly-sampled spatial data; standardizing measurements for irregularly-sampled spatial data; more fun with strikes and left-wing politics. Limitations of the split/apply/combine pattern.
Shorter lecture 12: The lecturer is a gushing Hadley Wickham fanboy.
(This week's lectures are ripped off from slides by Vince Vu, with permission.)
Posted by crshalizi at October 10, 2012 10:30 | permanent link
Lecture 11: Design patterns and their benefits: clarity on what is to be done, flexibility about how to do it, ease of adapting others' solutions. The split/apply/combine pattern: divide big structured data sets up into smaller, related parts; apply the same analysis to each part independently; combine the results of the analyses. Trivial example: row and column means. Further examples. Iteration as a verbose, painful and clumsy implementation of split/apply/combine. Tools for split/apply/combine in basic R: the apply function for arrays, lapply for lists, mapply, etc.; split. Detailed example with a complicated data set: the relation between strikes and parliamentary politics.
Posted by crshalizi at October 08, 2012 10:30 | permanent link
In which we continue to practice using functions as arguments and as return values, while learning something about the standard error of maximum likelihood estimates, and about the modularity of methods like the jack-knife.
Posted by crshalizi at October 05, 2012 11:30 | permanent link
In which we practice passing functions as arguments to other functions, by way of an introduction to likelihood and its maximization; and, incidentally, work more with plotting in R.
Posted by crshalizi at October 05, 2012 10:30 | permanent link
Lecture 10: Functions in R are objects, just like everything else, and so can be both arguments to and return values of functions, with no special machinery required. Examples from math (especially calculus) of functions with other functions as arguments. Some R syntax relating to functions. Examples with curve. Using sapply to extend functions of single numbers to functions of vectors; its combination with curve. We write functions with lower-level functions as arguments to abstract out a common pattern of operations. Example: calculating a gradient. Numerical gradients by first differences, done two different ways. (Limitations of taking derivatives by first differences.) Incorporating this as a part of a larger algorithm, such as gradient descent. Using adapters, like wrapper functions and anonymous functions, to fit different functions together. Examples from math (especially calculus) of operators, which turn one function into another. The importance of scoping when using functions as return values. Example: creating a linear predictor. Example: implementing the gradient operator (two different ways). Example: writing surface, as a two-dimensional analog to the standard curve. The use of eval and substitute to control when and in what context an expression is evaluated. Three increasingly refined versions of surface, employing eval.
Posted by crshalizi at October 01, 2012 10:30 | permanent link
Attention conservation notice: I have no taste.
This edition delayed by my laziness and disorganization
going
to Allerton.
Books to Read While the Algae Grow in Your Fur; Scientifiction and Fantastica; Enigmas of Chance; The Beloved Republic; The Commonwealth of Letters; Minds, Brains, and Neurons; The Collective Use and Evolution of Concepts; Writing for Antiquity; Pleasures of Detection, Portraits of Crime
Posted by crshalizi at September 30, 2012 23:59 | permanent link
In which we continue to practice the arts of debugging and testing, while learning about making our code more general, handling awkward special cases, and pondering what it means to say that an observation is an outlier.
Posted by crshalizi at September 28, 2012 11:30 | permanent link
In which we use Tukey's rule for identifying outliers as an excuse to learn about debugging and testing.
Posted by crshalizi at September 28, 2012 10:30 | permanent link
Lecture 9: R looks for the values of names in the current environment; if it cannot find a value, it looks for the name in the environment which spawned this one, and so on up the tree to the common, global environment. Assignment is modifying the name/value association list which represents the environment. The scope of a name is limited by the current environment. Implications: changes within the current scope do not propagate back to the larger environments; changes in the larger environment do propagate to all smaller ones which it encloses, unless over-ridden by local names. Subtlety: the larger environment for a function is the one in which it was defined, not the one in which it is called. Some implications for design. Examination of the last homework from this stance.
Posted by crshalizi at September 26, 2012 10:30 | permanent link
In which we meet the parametric bootstrap traveling
incognito probe the precision of our estimation method from the last
lab, by seeing how well it would work when the model is true and we know the
parameters.
Posted by crshalizi at September 24, 2012 13:44 | permanent link
In which we meet the jackknife, by way of seeing how much error there is in our estimates from the last lab.
Posted by crshalizi at September 24, 2012 13:43 | permanent link
Lecture 8: Debugging is an essential and perpetual part of programming. Debugging as differential diagnosis: characterize the bug, localize it in the code, try corrections. Tactics for characterizing the bug. Tactics for localizing the bug: traceback, print, warning, stopifnot. Test cases and dummy input generators. Interactive debuggers. Programming with an eye to debugging: writing code with comments and meaningful names; designing the code in a top-down, modular, functional manner; writing and using tests. A hint at the exception-handling system.
Posted by crshalizi at September 24, 2012 13:42 | permanent link
Lecture 7: Our code implements a method for solving problems we expect to encounter in the future; but why should we trust those solutions? We establish the reliability of the code by testing it. To respect the interfaces of the code, we test the substance of the answers, not the procedure used to obtain them, even though it is the reliability of the procedure we ultimate care about. We test both for the actual answer in particular cases and by cross-checking different uses of the same code which should lead to the same answer. Because we do not allow our tests to give us any false alarms, their power to detect errors is limited, and must be focused at particular kinds of errors. We make a virtue of necessity by using a diverse battery of tests, and shaping the tests so that they tell us where errors arise. The testing-programming cycle alternates between writing code and testing its correctness, adding new tests as new errors are discovered. The logical extreme of this is test-driven development, where tests represent the specification of the software's behavior in terms of practical consequences. Drawbacks of testing. Some pointers to more advanced tools for writing, maintaining and using tests in R.
(Why yes, this lecture was something of a lay sermon on epistemology.)
Posted by crshalizi at September 24, 2012 13:41 | permanent link
Lecture 6: Top-down design is a recursive heuristic for solving problems by writing functions: start with a big-picture view of the problem; break it into a few big sub-problems; figure out how to integrate the solutions to each sub-problem; and then repeat for each part. The big-picture view: resources (mostly arguments), requirements (mostly return values), the steps which transform the one into the other. Breaking into parts: try not to use more than 5 sub-problems, each one a well-defined and nearly-independent calculation; this leads to code which is easy to understand and to modify. Synthesis: assume that a function can be written for each sub-problem; write code which integrates their outputs. Recursive step: repeat for each sub-problem, until you hit something which can be solved using the built-in functions alone. Top-down design forces you to think not just about the problem, but also about the method of solution, i.e., it forces you to think algorithmically; this is why it deserves to be part of your education in the liberal arts. Exemplification: how we could write the lm function for linear regression, if it did not exist and it were necessary to invent it.
Additional optional reading: Herbert Simon, The Sciences of the Artificial.
Posted by crshalizi at September 24, 2012 13:40 | permanent link
Next week, we have one of our graduate student seminars, where the speakers are selected, and all the organizing work is done, by our graduate students:
Posted by crshalizi at September 14, 2012 22:30 | permanent link
In which we see how to minimize the mean squared error when there are two parameters, in the process learning about writing functions, decomposing problems into smaller steps, testing the solutions to the smaller steps, and minimization by gradient descent.
Posted by crshalizi at September 14, 2012 11:30 | permanent link
In which we practice the arts of writing functions and of estimating distributions, while contemplating just how little room there is in the heart of a cat.
Posted by crshalizi at September 14, 2012 10:30 | permanent link
Lecture 5: Using multiple functions to solve multiple problems; to sub-divide awkward problems into more tractable ones; to re-use solutions to recurring problems. Value of consistent interfaces for functions working with the same object, or doing similar tasks. Examples: writing prediction and plotting functions for the model from the last lab. Advantages of splitting big problems into smaller ones with their own functions: understanding, modification, design, re-use of work. Trade-off between internal sub-functions and separate functions. Re-writing the plotting function to use the prediction function. Recursion. Example: re-writing the resource allocation code to be more modular and recursive. R for examples.
Posted by crshalizi at September 10, 2012 10:03 | permanent link
Lecture 4: Just as data structures tie related values together into objects, functions tie related commands together into objects. Declaring functions. Arguments (inputs) and return values (outputs). Named arguments, defaults, and calling functions. Interfaces: controlling what the function can see and do; first sketch of scoping rules. The importance of the interface. An example of writing and improving a function, for fitting the model from the last lab. R for examples.
Posted by crshalizi at September 10, 2012 10:02 | permanent link
In which we use nonlinear least squares to fit the West et al. model.
Posted by crshalizi at September 10, 2012 10:01 | permanent link
In which we make incremental improvements to our code for planning by incremental improvements.
Posted by crshalizi at September 10, 2012 10:00 | permanent link
Attention conservation notice: Advertises writings of economic theorists, utterly detached from the real world, as part of a long-running argument among academic bloggers.
Because Brad DeLong wants to revive a discussion from two years ago about "Hobbesian" tendencies in economics, I am reminded of a truly excellent paper which Brendan O'Connor told me about a few months I ago:
The abstract does not do this justice, so I'll quote from the introduction (their italics).
In the typical analysis of an exchange economy, agents are involved in consumption and exchange goods voluntarily when mutually beneficial. The endowments and the preferences are the primitives of the model. The distribution of consumption in society is determined endogenously through trade.This paper is motivated by a complementary perspective on human interaction. Throughout the history of mankind, it has been quite common (and we suspect that it will remain so in the future) that economic agents, individually or collectively, use power to seize control of assets held by others. The exercise of power is pervasive in every society and takes several forms. ...
We introduce and analyse an elementary model of a society, called the jungle, in which economic transactions are governed by coercion. The jungle consists of a set of individuals, who have exogenous preferences over a bounded set of consumption bundles (their capacity to consume is finite), and of an exogenous ranking of the agents according to their strength. This ranking is unambiguous and known to all. Power, in our model, has a simple and strict meaning: a stronger agent is able to take resources from a weaker agent.
The jungle model mirrors the standard model of an exchange economy. In both models, the preferences of the agents over commodity bundles and the total endowment of goods are given. The distribution of power in the jungle is the counterpart of the distribution of endowments in the market. As the incentives to produce or collect the goods are ignored in an exchange economy, so are the incentives to build strength in the jungle.
We define a jungle equilibrium as a feasible allocation of goods such that no agent would like and is able to take goods held by a weaker agent. We demonstrate several properties that equilibrium allocation of the jungle shares with the equilibrium allocation of an exchange economy. In particular, we will show that under standard assumptions a jungle equilibrium exists and is Pareto efficient. In addition, we will show that there exist prices that 'almost' support the jungle equilibrium as a competitive equilibrium.
Appreciating this requires a little background. There are multiple arguments to be made on behalf of the market system. The one which the mainstream of the discipline of economics likes to emphasize, and to teach, is the "first fundamental theorem of welfare economics". Assume some obviously false conditions about what people want, and still more obvious falsehoods about the institutions they have. (There need to be competitive markets in literally everything anyone might want, for instance.) Then let people trade with each other if they want to, and only if they want to. The market comes to equilibrium when no one wants to trade any more. This equilibrium is a situation where nobody can be made better off (by their own lights) without someone else being made worse off. That is, the equilibrium is "Pareto optimal" or "Pareto efficient". (Actually, the theory almost never considers the actual dynamics of the exchange, for good reasons; it just shows that every equilibrium is Pareto optimal*.) This theorem gets invoked a lot by serious members of the profession in their writings and teaching. I will leave supporting citations and quotations for this point to Mark Blaug's "The Fundamental Theorems of Modern Welfare Economics, Historically Contemplated" (History of Political Economy 39 (2007): 185--207). Suffice it to say that many, I suspect most, economists take this to be a strong argument for why market systems are better than alternatives, why market outcomes should be presumed to be good, etc.
A conventional assault on this is to argue that the result is not robust — since we know that the premises of the theorems are quite false, those theorems don't say anything about the virtues of actually-existing markets. Then one has mathematical questions about whether the results still hold if the assumptions are relaxed (generically, no), and empirical questions about processes of production, consumption and distribution.
What Piccione and Rubinstein have done is quite different. They have shown that the same optimality claims can be made on behalf of the most morally objectionable way of allocating resources. "The jungle" takes the horrible message of the Melian dialogue, that "the strong do what they can and the weak suffer what they must", and turns it into the sole basis of social intercourse**. And yet everything which general equilibrium theory says in favor of the Utopian market system is also true of the rule of force. In this hybrid of Hobbes and Leibniz, the state of nature is both just as repugnant as Hobbes said, and yet also the best of all possible worlds.
Piccione and Rubinstein's paper undermines the usual economists' argument from Pareto optimality, because it shows not just one or two horrible Pareto optima (those are very easy to come up with), but a horrible system which is nonetheless Pareto-efficient. Of course, there are other cases to make on behalf of markets and/or capitalism than the welfare theorems. (But: the jungle is fully decentralized; free from meddling bureaucrats or improving intellectuals; provides strong incentives for individual initiative, innovative thinking, and general self-improvement; and of no higher computational complexity than an Arrow-Debreu economy.) I should add that anyone who actually grasps the textbook accounts of welfare economics should certainly be able to follow this well-written paper. They will also benefit from the very sensible concluding section 5.2 about the rhetoric of economists.
*: The second fundamental theorem is that, roughly speaking, every Pareto optimum is a competitive equilibrium, attainable by a one-time transfer of goods. This does not hold for "the jungle" (section 4.2 of Piccione and Rubinstein).
**: Hobbes — this was originally a conversation about Hobbes — was, of course, highly influenced by Thucydides, going so far as to translate The Peloponnesian War. (His version of the line is "they that have odds of power exact as much as they can, and the weak yield to such conditions as they can get".)
Posted by crshalizi at September 09, 2012 22:29 | permanent link
Attention conservation notice: As though I don't drone on about technical books too much as it is, pointers to five reviews averaging 2,000+ words each.
Some notes on books which grew too large for the end-of-the-month wrap-ups:
The review of Cox and Donnelly originally ran in American Scientist. The reviews of Moore and Mertens, and of Bühlmann and van de Geer, were things I started last year and only just finished.
Posted by crshalizi at September 08, 2012 12:16 | permanent link
Lecture 3: Conditioning the calculation on the data: if; what is truth?; Boolean operators again; switch. Iteration to repeat similar calculations: for and iterating over a vector; while and conditional iteration (reducing for to while); repeat and unconditional iteration, with break to exit loops (reducing while to repeat). Avoiding iteration with "vectorized" operations and functions: the advantages of the whole-object view; some examples and techniques: mathematical operators and functions, ifelse; generating arrays with repetitive structure.
Posted by crshalizi at September 07, 2012 00:30 | permanent link
For the first seminar of the new academic year, we are very pleased to welcome —
As always, the seminar is free and open to the public.
Posted by crshalizi at September 06, 2012 14:49 | permanent link
Attention conservation notice: I have no taste.
7.2 Scientific Laws
Scientific laws are expressions of quantitative relationships between variables in nature that have been validated by a combination of observational and experimental evidence.As with laws in everyday life, accepted scientific laws can be challenged over time as new evidence is acquired. The philosopher Karl Popper summarizes this by emphasizing that science progresses not by proving things, but by disproving them (Popper, 1959, p. 31). To put this another way, a scientific hypothesis must, at least in principle, be falsifiable by experiment (iron is more dense than water), whereas a personal belief need not be (Charlie Parker was a better saxophonist than John Coltrane).
7.3 Turning a Scientific Theory into a Statistical Model...
That sound you hear is pretty much every philosopher of science since Popper and Hempel, crying out from Limbo, "Have we lived and fought in vain?"
Books to Read While the Algae Grow in Your Fur; Enigmas of Chance; Scientifiction and Fantastica; Afghanistan and Central Asia; Biology; Writing for Antiquity
Posted by crshalizi at August 31, 2012 23:59 | permanent link
In which we play around with basic data structures and convince ourself that the laws of probability are, in fact, right. (Or perhaps that R's random number generator is pretty good.)
Posted by crshalizi at August 31, 2012 10:10 | permanent link
In which we practice working with data frames, grapple with some of the subtleties of R's system of data types, and calculate the consequences of doodling while bored in lecture.
Assignment, due at 11:59 pm on Thursday, 6 September 2012
Posted by crshalizi at August 29, 2012 14:30 | permanent link
Lecture 2: Matrices as a special type of array; functions for matrix arithmetic and algebra: multiplication, transpose, determinant, inversion, solving linear systems. Using names to make calculations clearer and safer: resource-allocation mini-example. Lists for combining multiple types of values; access sub-lists, individual elements; ways of adding and removing parts of lists. Lists as key-value pairs. Data frames: the data structure for classic tabular data, one column per variable, one row per unit; data frames as hybrids of matrices and lists. Structures of structures: using lists recursively to creating complicated objects; example with eigen.
Posted by crshalizi at August 29, 2012 11:20 | permanent link
Attention conservation notice: 2500 words of statisticians quarreling with econometricians about arcane points of statistical theory.Long, long ago, I tried to inveigle Larry into writing this, by promising I would make it a guest post. Larry now has his own blog, but a promise is a promise. More to the point, while I can't claim any credit for it, I'm happy to endorse it, and to pushing it along by reproducing it. Everything between the horizontal lines is by Jamie and Larry, though I tweaked the formatting trivially.
Note: This blog post is written by two people and it is cross-posted at Normal Deviate and Three Toed Sloth.
Chris Sims is a Nobel prize winning economist who is well known for his work on macroeconomics, Bayesian statistics, vector autoregressions among other things. One of us (LW) had the good fortune to meet Chris at a conference and can attest that he is also a very nice guy.
Chris has a paper called On an An Example of Larry Wasserman. This post is a response to Chris' paper.
The example in question is actually due to Robins and Ritov (1997). A simplified version appeared in Wasserman (2004) and Robins and Wasserman (2000). The example is related to ideas from the foundations of survey sampling (Basu 1969, Godambe and Thompson 1976) and also to ancillarity paradoxes (Brown 1990, Foster and George 1996).
Here is (a version of) the example. Consider iid random variables \[ (X_1,Y_1,R_1),\ldots, (X_n,Y_n,R_n). \] The random variables take values as follows: \[ X_i \in [0,1]^d,\ \ \ Y_i \in\{0,1\},\ \ \ R_i \in\{0,1\}. \] Think of \( d \) as being very, very large. For example, \( d=100,000 \) and \( n=1,000 \).
The idea is this: we observe \( X_i \). Then we flip a biased coin \( R_i \). If \( R_i=1 \) then you get to see \( Y_i \). If \( R_i=0 \) then you don't get to see \( Y_i \). The goal is to estimate \[ \psi = P(Y_i=1). \] Here are the details. The distribution takes the form \[ p(x,y,r) = p_X(x) p_{Y|X}(y|x)p_{R|X}(r|x). \] Note that \( Y \) and \( R \) are independent, given \( X \). For simplicity, we will take \( p(x) \) to be uniform on \( [0,1]^d \). Next, let \[ \theta(x) \equiv p_{Y|X}(1|x) = P(Y=1|X=x) \] where \( \theta(x) \) is a function. That is, \( \theta:[0,1]^d \rightarrow [0,1] \). Of course, \[ p_{Y|X}(0|x)= P(Y=0|X=x) = 1-\theta(x). \] Similarly, let \[ \pi(x)\equiv p_{R|X}(1|x) = P(R=1|X=x) \] where \( \pi(x) \) is a function. That is, \( \pi:[0,1]^d \rightarrow [0,1] \). Of course, \[ p_{R|X}(0|x)= P(R=0|X=x) = 1-\pi(x). \]
The function \( \pi \) is known. We construct it. Remember that \( \pi(x) = P(R=1|X=x) \) is the probability that we get to observe \( Y \) given that \( X=x \). Think of \( Y \) as something that is expensive to measure. We don't always want to measure it. So we make a random decision about whether to measure it. And we let the probability of measuring \( Y \) be a function \( \pi(x) \) of \( x \). And we get to construct this function.
Let \( \delta>0 \) be a known, small, positive number. We will assume that \[ \pi(x)\geq \delta \] for all \( x \).
The only thing in the the model we don't know is the function \( \theta(x) \). Again, we will assume that \[ \delta \leq \theta(x) \leq 1-\delta. \] Let \( \Theta \) denote all measurable functions on \( [0,1]^d \) that satisfy the above conditions. The parameter space is the set of functions \( \Theta \).
Let \( {\cal P} \) be the set of joint distributions of the form \[ p(x) \, \pi(x)^r (1-\pi(x))^{1-r}\, \theta(x)^y (1-\theta(x))^{1-y} \] where \( p(x)=1 \), and \( \pi(\cdot) \) and \( \theta(\cdot) \) satisfy the conditions above. So far, we are considering the sub-model \( {\cal P}_\pi \) in which \( \pi \) is known.
The parameter of interest is \( \psi = P(Y=1) \). We can write this as \[ \psi = P(Y=1)= \int_{[0,1]^d} P(Y=1|X=x) p(x) dx = \int_{[0,1]^d} \theta(x) dx. \] Hence, \( \psi \) is a function of \( \theta \). If we know \( \theta(\cdot ) \) then we can compute \( \psi \).
The usual frequentist estimator is the Horwitz-Thompson estimator \[ \hat\psi = \frac{1}{n}\sum_{i=1}^n \frac{ Y_i R_i}{\pi(X_i)}. \] It is easy to verify that \( \hat\psi \) is unbiased and consistent. Furthermore, \( \hat\psi - \psi = O_P(n^{-\frac{1}{2}}) \). In fact, let us define \[ I_n = [\hat\psi - \epsilon_n,\ \hat\psi + \epsilon_n] \] where \[ \epsilon_n = \sqrt{\frac{1}{2n\delta^2}\log\left(\frac{2}{\alpha}\right)}. \] It follows from Hoeffding's inequality that \[ \sup_{P\in{\cal P}_\pi} P(\psi \in I_n)\geq 1-\alpha \] Thus we have a finite sample, \( 1-\alpha \) confidence interval with length \( O(1/\sqrt{n}) \).
Remark: We are mentioning the Horwitz-Thompson estimator because it is simple. In practice, it has three deficiencies:
To do a Bayesian analysis, we put some prior \( W \) on \( \Theta \). Next we compute the likelihood function. The likelihood for one observation takes the form \( p(x) p(r|x) p(y|x)^r \). The reason for having \( r \) in the exponent is that, if \( r=0 \), then \( y \) is not observed so the \( p(y|x) \) gets left out. The likelihood for \( n \) observations is \[ \prod_{i=1}^n p(X_i) p(R_i|X_i) p(Y_i|X_i)^{R_i} = \prod_i \pi(X_i)^{R_i} (1-\pi(X_i))^{1-R_i}\, \theta(X_i)^{Y_i R_i} (1-\theta(X_i))^{(1-Y_i)R_i}. \] where we used the fact that \( p(x)=1 \). But remember, \( \pi(x) \) is known. In other words, \( \pi(X_i)^{R_i} (1-\pi(X_i))^{1-R_i} \) is known. So, the likelihood is \[ {\cal L} (\theta) \propto \prod_i \theta(X_i)^{Y_i R_i} (1-\theta(X_i))^{(1-Y_i)R_i}. \]
Combining this likelihood with the prior \( W \) creates a posterior distribution on \( \Theta \) which we will denote by \( W_n \). Since the parameter of interest \( \psi \) is a function of \( \theta \), the posterior \( W_n \) for \( \theta \) defines a posterior distribution for \( \psi \).
Now comes the interesting part. The likelihood has essentially no information in it.
To see that the likelihood has no information, consider a simpler case where \( \theta(x) \) is a function on \( [0,1] \). Now discretize the interval into many small bins. Let \( B \) be the number of bins. We can then replace the function \( \theta \) with a high-dimensional vector \( \theta = (\theta_1,\ldots, \theta_B) \). With \( n < B \), most bins are empty. The data contain no information for most of the \( \theta_j \)'s. (You might wonder about the effect of putting a smoothness assumption on \( \theta(\cdot ) \). We'll discuss this in Section 4.)
We should point out that if \( \pi(x) = 1/2 \) for all \( x \), then Ericson (1969) showed that a certain exchangeable prior gives a posterior that, like the Horwitz-Thompson estimator, converges at rate \( O(n^{-1/2}) \). However we are interested in the case where \( \pi(x) \) is a complex function of \( x \); then the posterior will fail to concentrate around the true value of \( \psi \). On the other hand, a flexible nonparametric prior will have a posterior essentially equal to the prior and, thus, not concentrate around \( \psi \), whenever the prior \( W \) does not depend on the the known function \( \pi(\cdot) \). Indeed, we have the following theorem from Robins and Ritov (1997):
Theorem (Robins and Ritov 1997). Any estimator that is not a function of \( \pi(\cdot) \) cannot be uniformly consistent.
This means that, at no finite sample size, will an estimator \( \hat\psi \) that is not a function of \( \pi \) be close to \( \psi \) for all distributions in \( {\cal P} \). In fact, the theorem holds for a neighborhood around every pair \( (\pi,\theta) \). Uniformity is important because it links asymptotic behavior to finite sample behavior. But when \( \pi \) is known and is used in the estimator (as in the Horwitz-Thompson estimator and its improved versions) we can have uniform consistency.
Note that a Bayesian will ignore \( \pi \) since the \( \pi(X_i)'s \) are just constants in the likelihood. There is an exception: the Bayesian can make the posterior be a function of \( \pi \) by choosing a prior \( W \) that makes \( \theta(\cdot) \) depend on \( \pi(\cdot) \). But this seems very forced. Indeed, Robins and Ritov showed that, under certain conditions, any true subjective Bayesian prior \( W \) must be independent of \( \pi(\cdot) \). Specifically, they showed that once a subjective Bayesian queries the randomizer (who selected \( \pi \)) about the randomizer's reasoned opinions concerning \( \theta (\cdot) \) (but not \( \pi(\cdot) \)) the Bayesian will have independent priors. We note that a Bayesian can have independent priors even when he believes with probabilty 1 that \( \pi \left( \cdot \right) \) and \( \theta \left( \cdot \right) \) are positively correlated as functions of \( x \) i.e. \( \int \theta \left( x\right) \pi \left( x\right) dx>\int \theta \left(x\right) dx \) \( \int \pi \left( x\right) dx. \) Having independent priors only means that learning \( \pi \left(\cdot \right) \) will not change one's beliefs about \( \theta \left( \cdot \right) \). So far, so good. As far as we know, Chris agrees with everything up to this point.
Chris goes on to raise alternative Bayesian approaches.
The first is to define \[ Z_i = \frac{R_i Y_i}{\pi(X_i)}. \] Note that \( Z_i \in \{0\} \cup [1,\infty) \). Now we ignore (throw away) the original data. Chris shows that we can then construct a model for \( Z_i \) which results in a posterior for \( \psi \) that mimics the Horwitz-Thompson estimator. We'll comment on this below, but note two strange things. First, it is odd for a Bayesian to throw away data. Second, the new data are a function of \( \pi(X_i) \) which forces the posterior to be a function of \( \pi \). But as we noted earlier, when \( \theta \) and \( \pi \) are a priori independent, the \( \pi(X_i)'s \) do not appear in the posterior since they are known constants that drop out of the likelihood.
A second approach (not mentioned explicitly by Chris) which is related to the above idea, is to construct a prior \( W \) that depends on the known function \( \pi \). It can be shown that if the prior is chosen just right then again the posterior for \( \psi \) mimics the (improved) Horwitz-Thompson estimator.
Lastly, Chris notes that the posterior contains no information because we have not enforced any smoothness on \( \theta(x) \). Without smoothness, knowing \( \theta(x) \) does not tell you anything about \( \theta(x+\epsilon) \) (assuming the prior \( W \) does not depend on \( \pi \)).
This is true and better inferences would obtain if we used a prior that enforced smoothness. But this argument falls apart when \( d \) is large. (In fairness to Chris, he was referring to the version from Wasserman (2004) which did not invoke high dimensions.) When \( d \) is large, forcing \( \theta(x) \) to be smooth does not help unless you make it very, very, very smooth. The larger \( d \) is, the more smoothness you need to get borrowing of information across different values of \( \theta(x) \). But this introduces a huge bias which precludes uniform consistency.
We have seen that response 3 (add smoothness conditions in the prior) doesn't work. What about response 1 and response 2? We agree that these work, in the sense that the Bayes answer has good frequentist behavior by mimicking the (improved) Horwitz-Thompson estimator.
But this is a Pyrrhic victory. If we manipulate the data to get a posterior that mimics the frequentist answer, is this really a success for Bayesian inference? Is it really Bayesian inference at all? Similarly, if we choose a carefully constructed prior just to mimic a frequentist answer, is it really Bayesian inference?
We call Bayesian inference which is carefully manipulated to force an answer with good frequentist behavior, frequentist pursuit. There is nothing wrong with it, but why bother?
If you want good frequentist properties just use the frequentist estimator. If you want to be a Bayesian, be a Bayesian but accept the fact that, in this example, your posterior will fail to concentrate around the true value.
In summary, we agree with Chris' analysis. But his fix is just frequentist pursuit; it is Bayesian analysis with unnatural manipulations aimed only at forcing the Bayesian answer to be the frequentist answer. This seems to us to be an admission that Bayes fails in this example.
Basu, D. (1969). Role of the Sufficiency and Likelihood Principles in Sample Survey Theory. Sankya, 31, 441--454.
Brown, L. D. (1990). An ancillarity paradox which appears in multiple linear regression. The Annals of Statistics, 18, 471-493.
Ericson, W. A. (1969). Subjective Bayesian models in sampling finite populations. Journal of the Royal Statistical Society. Series B, 195-233.
Foster, D. P. and George, E. I. (1996). A simple ancillarity paradox. Scandinavian journal of statistics, 233-242.
Godambe, V. P., and Thompson, M. E. (1976), Philosophy of Survey-Sampling Practice. In Foundations of Probability Theory, Statistical Inference and Statistical Theories of Science, eds. W. L.Harper and A. Hooker, Dordrecht: Reidel.
Robins, J. M. and Ritov, Y. (1997). Toward a Curse of Dimensionality Appropriate (CODA) Asymptotic Theory for Semi-parametric Models. Statistics in Medicine, 16, 285--319.
Robins, J. and Wasserman, L. (2000). Conditioning, likelihood, and coherence: a review of some foundational concepts. Journal of the American Statistical Association, 95, 1340--1346
Rotnitzky, A., Lei, Q., Sued, M. and Robins, J. M. (2012). Improved double-robust estimation in missing data and causal inference models. Biometrika, 99, 439-456.
Scharfstein, D. O., Rotnitzky, A. and Robins, J.M. (1999). Adjusting for nonignorable drop-out using semiparametric nonresponse models. Journal of the American Statistical Association, 1096-1120.
Sims, Christopher. On An Example of Larry Wasserman. Available at: http://www.princeton.edu/~sims/.
Wasserman, L. (2004). All of Statistics: a Concise Course in Statistical Inference. Springer Verlag.
Update, 29 August: Sims responds in the comments over on Larry's blog (multiple times), plus a counter-response from Jamie, a follow-up post from Larry and Jamie, counter-counter-responses from Sims, and more.
Manual trackback: Brad DeLong
Posted by crshalizi at August 28, 2012 08:42 | permanent link
Introduction to the course: statistical programming for autonomy, honesty, and clarity of thought. The functional programming idea: write code by building functions to transform input data into desired outputs. Basic data types: Booleans, integers, characters, floating-point numbers. Subtleties of floating point numbers. Operators as basic functions. Variables and names. An example with resource allocation. Related pieces of data are bundled into larger objects called data structures. Most basic data structures: vectors. Some vector manipulations. Functions of vectors. Naming of vectors. Continuing the resource-allocation example. Building more complicated data structures on top of vectors. Arrays as a first vector structure.
Posted by crshalizi at August 27, 2012 23:15 | permanent link
Attention conservation notice: Posted because I got tired of repeating it to nervous new graduate students. You are not beginning graduate school at a research university. (Any resemblance to how I treat the undergrads in ADA is entirely deliberate.)
Graduate school, especially at the beginning, is an ego-destroying, even humiliating, experience. People who are used to being good at what they do get set impossible tasks by elders they look up to, and the students have their faces ground in their failures. Everything is designed to encourage self-doubt. This is not an accident. Graduate school is not just about teaching certain specific skills; it is about breaking down your old persona to make room for a new one, to turn out a certain kind of person. It has evolved so that authority figures make it very clear that the new inductees possess no accomplishments of any worth — but that if they work very hard, beyond ordinary expectation, they can emerge as the peers of the authorities, the only kind of person worthy of respect, members for life of the fraternity.
In other words: welcome to boot camp, maggots! It's a sad day for our beloved discipline when we have to take unpromising specimens like you — and yes, that includes you, I know your type — but maybe, possibly, just maybe, one or two of you might have what it takes to become scholars...
Graduate school is not, obviously, physically demanding. (For that matter, few of your instructors can pull off battle-dress and a Sam Browne belt; avoid the ones who try.) Our version of "Drop and give me fifty" is "Prove these functions are measurable" — or, perhaps more insidiously, "Really? What does the literature say about that point?" (Actual question at an oral exam in my physics department: "Explain how a radio works. You may start from Maxwell's equations.") But we are playing the same mind-games: removing you from your usual friends and associates, working you constantly, dis-orienting you with strange new concepts and vocabulary, surrounding you with people who are either in on the act or also enduring the initiation, and perpetually reinforcing that the only thing which matters is whether you excel in this particular program. This is an institution which has persisted over, literally, a thousand years by consuming young people like you and spitting out scholars with the attitudes and habits of mind it needs to perpetuate itself, and it is very good at getting inside your head.
There are many ways to cope with this, but what I would suggest is to remember, fiercely, that it's all bullshit. You are a bad-ass, whatever happens in school. It may have practical consequences, but it doesn't matter, and any impression we give to the contrary is just part of the bullshit. Hold on to that fact, internalize it, feel it, and let the stress and strain pass through you without distorting you.
You will still prove the theorems I tell you to prove, but you'll remember that this doesn't matter to who you are. If you decide to care about academia, it will be a conscious choice, and not the institution turning you into its means of reproduction.
Posted by crshalizi at August 24, 2012 12:06 | permanent link
It's that time of year again:
Further details can be found at the class website. Teaching materials (lecture slides, homeworks, labs, etc.), will appear both there and here.
— This is the second time the department has done this course. Last
year, Vince Vu and I made it up, and I
learned a lot from teaching it with him. This year,
he's been carried
to Ohio in a swarm of bees
got a job at Ohio State,
so I'll have to pull it off without his help. Another change is that instead
of having a (very reasonable) 26 students, I've got 42 people signed up and
more on the waiting list. Only 23 of those are statistics majors, however, and
I am tempted to scare the rest away not sure that the others
fully appreciate what they have signed up for. We'll see.
Corrupting the Young; Enigmas of Chance; Introduction to Statistical Computing
Posted by crshalizi at August 21, 2012 14:59 | permanent link
But enough about the single worst book I read last year. Here, in honor of National Black Cat Appreciation Day, is Kara helping me sort through relics from graduate school:
Kara feels that section 207, on how the spirit of objectivity, and the type of person who cultivates it, have merely instrumental value ("a mirror" in "the hand of one more powerful") is alright as far as it goes, but it misses the more fundamental truth, that all human beings have merely instrumental value — in the service of cats.
Posted by crshalizi at August 17, 2012 22:31 | permanent link
Attention conservation notice: Self-promoting a dry academic comment on a bad book about bias in the US media.
It seems that the Perspective on Politics review symposium on Groseclose's Left Turn, organized by Henry Farrell, is finally out. This includes a contribution by Justin Gross, Andrew Gelman and your humble narrator, focusing on the methodological problems, which are, to my mind, crippling. (Of the other contributions, the only one I've had a chance to read is Brendan Nyhan's, which, unsurprisingly, I like.)
There's no abstract, so I'll just quote our opening.
In Left Turn, Groseclose concludes that, in a world without media bias, the average American voter would be positioned at around 25 on a 0--100 scale, where 0 is a right-wing Republican and 100 is a left-wing Democrat. In this world, a balanced media might include some TV networks promoting the view that abortion should be illegal under all circumstances and subject to criminal penalties, whereas others might merely hold that Roe v. Wade is unconstitutional; some media outlets might support outright discrimination against gays whereas others might be neutral on civil unions but oppose gay marriage; and on general politics there might be some newspapers that endorse hard-right Republican candidates (0 on Groseclose's 0--100 scale) whereas those on the left would endorse positions near those currently held by Senator Olympia Snowe. But instead of this, Groseclose must endure a world where he estimates the average voter is around 50, with all that follows from this, and he attributes this difference to media bias.Groseclose sets up this stirring climax by formulating and estimating three models. The first model, from Groseclose and Milyo (2005), is an ideal-point model that puts media organizations and members of Congress on that 100 point scale, based on how often they refer to various research and advocacy organizations. The second infers the political positions of voters in different districts based on how many of them voted for Obama, and the estimated positions of their members of Congress. The third model, new to Left Turn, is a causal model of how media influence the positions of voters. Groseclose's claims about what our country would look like if it weren't for media bias thus rest on a multi-stage analysis. (Figure 1 depicts his estimation strategy.) He estimates latent quantities, such as how Americans would vote if their views were not distorted by the media, in terms of other latent, estimated quantities, such as the political location of media organizations.
Groseclose's estimation strategy. Variables in boxes are observable; variables in ellipses are latent, and estimated. (The causal network implied by Groseclose's models is subtly different from this inferential network.) PQ and SQ stand for Groseclose's "political quotient" and "slant quotient", respectively.
You can read the rest at the journal, with nice formatting, or a preprint. That last link also carries you to the appendices on technical issues we couldn't fit into in the main article. Even the appendices leave out something which struck me when I read the book, that the models make no sense as strategic actors rationally maximizing utility. This doesn't make them any worse to my mind, but is the kind of thing the people who write and edit the Quarterly Journal of Economics purport to find troubling...
(As usual, I'm not speaking for the statistics department or CMU here, and everything in this post which goes beyond the article isn't the fault of my co-authors, etc.)
Self-Centered; Commit a Social Science; The Beloved Republic; The Running Dogs of Reaction
Posted by crshalizi at August 17, 2012 22:30 | permanent link
Attention conservation notice: Harrumphing about (failed) attempts at guilt-tripping.
You are welcome to send me things which you think deserve wider notice.
(Well, except for scammers trying to get me to give them free advertising, or
offering to write posts for me.) I, for my part, am free to not help your
efforts to promote your cause or endeavor. This blog is a calculated
tool of professional advancement through rhetorical self-fashioning and
structured
procrastination a personal hobby. It is not a public institution
with obligations to inform the world of every worthy undertaking or deplorable
injustice. If you disapprove that what I chose to write about this way is
slanted towards my interests and my friends, too bad.
Posted by crshalizi at August 06, 2012 23:20 | permanent link
Attention conservation notice: A call for academic papers on what entropy can say about the origins of life, two subjects you almost certainly don't care about.
Well, not exactly for:
Special Issue of Entropy: Equilibrium and Non-Equilibrium Entropy in the Origin of LifeFor more, see the full prospectus for the special issue — which will be open access.
Guest Editor: Dr. Eric Smith
Deadline for manuscript submissions: 30 December 2012Boltzmann (Populäre Schriften, 1905) characterized the Darwin/Malthus struggle for existence as a struggle for free energy, and Schrödinger (What is Life?, 1944) centered the physics of life around rejection of entropy from biomass to the nonliving environment. The rise of the paradigms of self-organization and dissipative structures have since led to proposals that the emergence of life might be understood as a spontaneous rejection of entropy, perhaps carried out by processes related to those that maintain life today.
The half-century since Schrödinger has seen major advances of two kinds in our understanding of entropy as it might pertain to the origin of life. The first is within equilibrium thermodynamics: more is known about sources of free energy that sustain life on earth, and more diverse and complete quantitative models exist for biochemistry, physiology, and ecology. In parallel, advances in non-equilibrium statistical mechanics and its large-deviation theory have shown how the concept of entropy maximization continues to explain the emergence and robustness of non-equilibrium ordered states, in cases where the rate functions defining the appropriate entropies (now, effective actions) differ from the equilibrium free energies. The latter advances show how kinetics may preempt equilibrium thermodynamics as the source of relevant constraints on the formation and persistence of ordered non-equilibrium states.
In this volume we seek to bring together mathematical insights from both equilibrium and non-equilibrium thermodynamics with expertise from empirical domains relevant to the emergence and early evolution of life, including planetary and space chemistry, biochemistry, evolutionary dynamics ranging from physical self-organization to population processes, the dynamics of both chemically homogeneous (e.g. RNA) and heterogeneous populations of molecules, and separations of time and spatial scales that lead to the emergence of memory, compartmentalization, control systems, individuality, or levels of development and selection. Collaborations that unify such domains are especially solicited.
Posted by crshalizi at August 06, 2012 23:15 | permanent link
Attention conservation notice: You are almost certainly not looking for a post-doc in network modeling.
My friends and co-authors are hiring post-docs to work on network data analysis. It's a great opportunity, and you should apply if you're good.
The Santa Fe Institute — a private, not-for-profit, theoretical research and education facility — has an opening for a full-time postdoc working on the study of networks. Funded by DARPA, the project focuses on the use of generative models to perform statistical inference. Based at the Santa Fe Institute, the postdoc will work closely with Professors Cristopher Moore, Santa Fe Institute (SFI); Aaron Clauset, University of Colorado (UC); and Mark Newman, University of Michigan (UM), and will have opportunities to travel to UC and UM. They are especially interested in community detection methods, including methods for detecting changes in community structure in dynamic graphs; functional groups that are not merely "clumps" of densely connected nodes; predicting missing links and identifying spurious ones; building on incomplete or noisy information about the network, generalizing from known attributes of nodes and edges to unknown ones; and identifying surprising or anomalous structures or events.The ideal candidate would be a confident programmer with strong analytical skills, and with a background in computer science, physics, applied mathematics, or other fields with strong quantitative training. Our main tools are Monte Carlo and message-passing algorithms, coupled with ideas from statistical physics. Familiarity with one or more of these techniques is desirable, but is not a requirement.
Subject to performance and available funding, the position will last up to three years, with an initial appointment of 18 months and a possible renewal for another 18 months. The expected start date is Summer or Fall of 2013, although for postdocs who already have their degree a slightly earlier start date may be possible.
This is a resident position, and postdoctoral fellows are strongly encouraged to interact and collaborate with members of the larger SFI community. The annual starting salary for the position will be $52,250 with full employee benefits including insurance, paid time off, and modest relocation support. Additional resources are available to assist with travel and other research needs.
To apply, please send an email containing your CV and a 1-page research statement to bkimbell [at] santafe.edu, with "DARPA postdoc" in the subject line. Please include names and contact information of at least three references. Full consideration will be given to applications received before January 13, 2013. For additional information or assistance, email Barbara or fax your request to 505-982-0565. You may also email Prof. Moore at moore [at] santafe.edu. No phone calls please.
The Santa Fe Institute is an equal opportunity employer, and women, veterans, and minorities are especially encouraged to apply. U.S. citizenship is not a requirement.
There will also be a parallel post-doc at Boulder, on the same terms; apply to that the same way.
Signal Amplification; Networks; Complexity; Enigmas of Chance
Posted by crshalizi at August 06, 2012 23:10 | permanent link
Attention conservation notice: I have no taste.
Books to Read While the Algae Grow in Your Fur; Pleasures of Detection, Portraits of Crime; Enigmas of Chance; Scientifiction and Fantastica
Posted by crshalizi at July 31, 2012 23:59 | permanent link
Attention conservation notice: 2200+ words expounding on some notions from statistical theory about over-fitting, plus describing a paper on some experiments trying to apply these ideas to UW-Madison undergrads, concluding with some speculative nihilism about common forms of trying to understand social life, going far beyond anything actually supported by either the general theory or the psychological experiments. Contains equations, ugly graphs, and long quotations from an academic paper.Mostly written several years ago, retrieved from the drafts folder for lack of lack of time to write anything new.
"Capacity control" is a central idea for statistical learning. The great challenge of devising a reliable learning procedure is avoiding over-fitting — getting models to memorizing apparent features of the training data which are really just noise, and will not generalize to new data. The "capacity" of a class of models is, roughly speaking, how many different data sets it can (seem to) fit well. High-capacity model classes are more flexible, but also more prone to over-fitting. In particular — a point insufficiently appreciated by many users — getting a really good fit in-sample from a high capacity model class is not strong evidence that the trained model will generalize well. Capacity control is the art of using models that are flexible enough to get good fits, without using ones which are so flexible that they over-fit.
There are various ways of shaping up this rough notion of "capacity" into something more quantitative, which we can work into theorems and practical tools. One nice one is what's called "Rademacher complexity", which goes as follows. Our models are just simple input-out functions; we get an input \( x \), we apply a particular model/function \( f \) to get a prediction \( f(x) \), and we want this to be close to the actual output \( y \). The Rademacher complexity of the class of models \( F \) is \[ R_n(F) \equiv \mathbf{E}_{X}\left[\mathbf{E}_{Z}\left[ \sup_{f\in F}{\left|\frac{1}{n} \sum_{i=1}^{n}{Z_i f(X_i) } \right|} \right]\right] \] where the \( Z_i \) are a sequence of random variables, independent of each other and everything else, and equal to +1 or -1 with equal probability, a.k.a. "Rademacher random variables". (It's customary to include an over-all factor of 2 in this definition, but I have my reasons for leaving it out here.)
To figure out what's going on here, start with the inner-most bit: \[ \left|\frac{1}{n} \sum_{i=1}^{n}{Z_i f(X_i) } \right| \] This is the magnitude of the sample covariance between a particular realization of the binary noise \( Z \), and the predictions of a particular model \( f \) on a particular set of input values \( X \). Next, holding fixed the noise and the inputs, we ask how big that covariance could appear to get over the whole model class: \[ \sup_{f\in F}{\left|\frac{1}{n} \sum_{i=1}^{n}{Z_i f(X_i)} \right|} \] Then we average over realizations of the binary noise: \[ \mathbf{E}_{Z}\left[ \sup_{f\in F}{\left|\frac{1}{n} \sum_{i=1}^{n}{Z_i f(X_i)} \right|} \right] \] This tells us, holding the inputs fixed, how well our model class would typically seem to predict binary noise. This is sometimes called the "empirical Rademacher complexity", because it's conditional on a particular training sample. Finally, we average over input training data. Generally, doing that last step as an actual calculation is hard, but you can show that the probability of the empirical Rademacher complexity fluctuating away from its expected value goes to zero exponentially fast in the sample size \( n \), so we can typically avoid the expectation over \( X \) at a small cost in approximation.
Now, if the class \( F \) just contained a single function, the business with the supremum wouldn't matter, and the Rademacher complexity is just the expected magnitude of the sample covariance of the function with the noise. Then \(R_n(F) \) has to go to zero as \( n \) grows, because, by the law of large numbers, the sample covariance is converging to the true covariance, which is zero. In fact if \( F \) contains only finitely many functions, \( R_n(F) \) has to go to zero because all the sample covariances become, with arbitrarily high probability, arbitrarily close to the true covariance, which is zero. But if there are infinitely many functions in \( F \), there might be trouble. How much trouble depends on, precisely, how many different sets of outputs we can construct for typical inputs.
Why this is a useful way of quantifying model capacity is a bit more involved than I feel like explaining, but the intuition, hopefully, is clear: a class of models which could give a good fit to pure noise is a class of models ripe for over-fitting. If on the other hand the Rademacher complexity of your class of models is low, and you nonetheless got a good fit to your training data, that is actually evidence that you will continue to fit well on new data. There's a simple formula if data are independent draws from a constant (but otherwise arbitrary) distribution, the functions \( f \) also have to output +1 or -1 (i.e., are binary classifiers), and we measure error by the probability of mis-classification. With probability at least \( 1-h \) under the true data-generating distribution, for all \( f \), \[ \mathrm{error}(f) - \widehat{\mathrm{error}(f)} \leq R_n(F) + \sqrt{\frac{\ln{1/h}}{2n}} \] The left-hand side by this bound is the amount by which the true error rate exceeds the in-sample error rate, i.e., the amount by which the model over-fits. The right-hand side combines the Rademacher complexity, which says how well the model class can seem to fit noise, plus a term which grows as we demand a higher level of confidence (smaller \( h \)). The lower the Rademacher complexity, the tighter the bounds we can put on the amount of over-fitting. Turned around, the probability that the amount of over-fitting exceeds the Rademacher complexity by any given amount is exponentially small.
These bounds actually make no reference to the actual learning process — they just depend on the kind of model available, and on how much flexibility those models have when presented with typical data from the distribution. The benefit of this is that we don't have to worry about how our learner works, just the kind of things it can learn. The drawback is that the bounds might be too conservative — maybe this learning procedure, on this sort of data, is much less prone to over-fitting than the bounds indicate.
All of which brings us to today's paper:
The procedure for estimating the Rademacher complexity of a human learner is ingenious. They gave each subject \( n \) labeled examples drawn from some domain, but with labels ("A" and "B" rather than -1 and +1) which were assigned completely randomly --- that is, the labels were Rademacher noise. After letting the subjects study the examples, they were distracted by being asked to do some arithmetic problems involving 10-digit numbers, and then given their \( n \) training examples again, but unlabeled, in a different, randomized order, and without being told these were the same examples. The subjects were asked to classify them, and the empirical Rademacher complexity for the subject was taken to be the sample covariance between guesses and labels; this was averaged over subjects.
This task was inflicted on 80 undergrads (presumably taking Intro. Psych. at Madison), with two different domains. Here I'll just quote:
The "Shape" Domain ... consists of 321 computer-generated 3D shapes ... parametrized by a real number \( x \in [0, 1] \), such that small \( x \) produces spiky shapes, while large \( x \) produces smooth ones.... It is important to note that this internal structure is unnecessary to the definition or measurement of Rademacher complexity per se. .... The "Word" Domain ... consists of 321 English words. We start with the Wisconsin Perceptual Attribute Ratings Database ... which contains words rated by 350 undergraduates for their emotional valence. We sort the words by their emotion valence, and take the 161 most positive and the 160 most negative ones for use in the study. ... Participants have rich knowledge about this domain. The size of the domain for shapes and words was matched to facilitate comparison.
While I'm at it, here's Figure 1 (the error bars being 95% confidence intervals):
As they note, in both domains, Rademacher complexity shrinks as \( n \) grows, so learning should be possible.
when \( n = 5 \), our interviews show that, in both domains, 9 out of 10 participants offered some spurious rules of the random labels. For example, one subject thought the shape categories were determined by whether the shape "faces" downward; another thought the word categories indicated whether the word contains the letter T. Such beliefs, though helpful in learning the particular training samples, amount to over-fitting the noise. In contrast, when \( n = 40 \), about half the participants indicated that they believed the labels to be random, as spurious "rules" are more difficult to find.
Also, the students had higher Rademacher complexity for words, with which they are very familiar, than for strange synthetic shapes:
The higher complexity indicates that, for the same sample sizes, participants are better able to find spurious explanations of the training data for the Words than for the Shapes. Two distinct strategies were apparent in the Word domain interviews: (i) Some participants created mnemonics. For example, one subject received the training sample (grenade, B), (skull, A), (conflict, A), (meadow, B), (queen, B), and came up with the following story: "a queen was sitting in a meadow and then a grenade was thrown (B = before), then this started a conflict ending in bodies & skulls (A = after)." (ii) Other participants came up with idiosyncratic, but often imperfect, rules. For instance, whether the item "tastes good," "relates to motel service," or "physical vs. abstract."
Having measured the Rademacher complexity of Madison undergrads, Zhu et al. then took the same domains and gave the students some actual prediction problems where generalization was possible: separating spiky from not-so-spiky shapes, separating shapes of medium spikiness from those which are either very spiky or very smooth, separating positive-valence words from those of negative valence, and separating words which are over five letters long from shorter words. (They did not tell them that these were the categories, of course.) This lets them compare the actual generalization performance --- i.e., the error rate on new data, not seen during training --- from the bounds implied by the Rademacher complexity.
It is not interesting that the humans' generalization error is lower than the theoretical bound on the generalization error; that goes along with being an upper bound. What's interesting is that Rademacher complexity nonetheless predicts how much over-fitting the students will do. It's not surprising that they do better at guessing the rules when they've seen 40 examples than when they've seen 5, but that seeing 40 word examples leads to more error than seeing 40 shapes is remarkable. What would be very nice, but doesn't appear here, would be experiments were domain, distribution and sample size were all different, but adjusted so that the human Rademacher complexity was equal, which would let us tease out how much that complexity as such predicts human learning.
While we await such experiments, I will speculate irresponsibly. I have long been skeptical about the sort of journalism or scholarship which looks at some trend at purports to tell us what it Really Means — often, in the more scholarly versions, the Deep Social Forces behind it, or the Hidden Ideological Motives. (See, e.g., the "Trees" section here.) Even when the trend actually exists, this seems to me far too vulnerable to Just So story-telling, that the explainers could provide equally compelling stories no matter what actually happened. To put it in terms of this paper, everyone is really, really familiar with the social life of the East African Plains Ape, yet we have very few truly independent historical examples, so our capacity to spin such stories is very large and \( n \) is very small, so \( R_n \) has to be very large, and none of our stories is going to generalize well. This is also part of what Duncan Watts is saying in Everything Is Obvious, Once You Know the Answer, about how, once they hear social-scientific findings, people find it easy to rationalize them as obvious --- but would be equally capable of coming up with equally-convincing rationalizations for the opposite findings. Hence the complete lack of substance in most of what passes for commentary on our common life. (Thomas Friedman is clearly a queen-in-a-meadow-with-grenades-and-skulls guy, while David Brooks is more "relates to motel service".) Some of these stories may even be right, but pointing to how compelling they explain everything we see is actually not very good evidence for them.
Posted by crshalizi at July 25, 2012 14:25 | permanent link
Attention conservation notice: 3500+ words on the scope of statistics, the teaching of statistics, and "data science". Drafted in October, forgotten until now, when I stumbled across it again in the course of prepping for next week's talk at JSM.
A follow-up, because lurkers1 demanded it in e-mail, and Cathy posted a response of sorts as well.
I'll start, as I perhaps should have done, with the case against statistics. Suppose you were exposed to that subject as a sub-cabalistic ritual of manipulating sums of squares and magical tables according to rules justified (if at all) only by a transparently false origin myth — that is to say, you had to endure what is still an all-too-common sort of intro. stats. class — or, perhaps worse, a "research methods" class whose content had fossilized before you were born2. Suppose you then looked at the genuinely impressive things done by the best of those who call themselves "data scientists". Well then no wonder you think "This is something new and wonderful"; and I would not blame you in the least for not connecting it with statistics. Perhaps you might find some faint resemblance, but it would be like comparing a child's toy wagon to a Ducati.
Modern statistics is not like that, and has not been for decades. Statistics has been, since its beginning, a branch of applied mathematics which designs and analyses methods for drawing reliable inferences from imperfect (incomplete, limited, distorted, noisy) data. ("Applied mathematics" doesn't quite have the right connotations; "mathematical engineering" would be better3. Other branches of mathematical engineering include optimization, computer science, and, recursively, numerical analysis.) Just as mechanical or electrical engineers, in order to design good machines and circuits, need to be able to analyze all kinds of machines and circuits, for us to design good inferential procedures, we need to analyze all sorts of methods of inference, and all sorts of reliability. We have found stochastic models to be very useful for this, so we use probability; we have developed some specialized mathematical concepts and techniques for the analyses, which we call "statistical theory". These are, or should be, always in the service of crafting methods of inference, being honest and careful about how reliable they are, and getting as much out of the data as we can.
To repeat myself, for a long time our theory about statistical-inference-in-general ran way, way ahead of what we could actually do with data, given the computational resources available to us. Over the last, say, thirty years, those computational constraints have, of course, drastically relaxed, and suddenly powerful and flexible methods which were once merely theoretical objects became executable software. This in turn opened up new theoretical avenues, which led to new methods of inference, and so on. This doesn't help with the fossils, and no doubt there are many places where it has not made its way down into the undergraduate curriculum, especially not into what is taught to non-statisticians.
None of this changes the fact that the skills of a "data scientist" are those of a modern statistician. Let me quote from Cathy's first post at some length:
Here are some basic skills you should be looking for when you're hiring a data scientist. They are general enough that they should have some form of all of them (but again don't be too choosy about exactly how they can address the below needs, because if they're super smart they can learn more):I will not pretend to speak about what is taught to undergraduates in every statistics department, but I can be quite specific about what we teach here. Students typically come to us taking a year-long basic statistics sequence; then a year of probability and mathematical statistics (some students enter here, and take more electives later); then modern regression and advanced data analysis; and then, or simultaneously, electives. (We require five upper-division statistics electives.) The electives run over statistical graphics, statistical computing, data mining, stochastic processes, surveys and sampling, epidemiology, experimental design, unsupervised learning and clustering, multivariate methods, complex systems, and potentially other subjects. (Not all of my colleagues, it seems, are as good about putting class materials on the Web as I'd like.) Graphics and computing are not required, but are popular and typically strongly urged on them. In the spring of their senior year (or sometimes even their junior year), as many of our majors as we can handle take the research projects class, where they spend a semester working in groups of 2--3 on data provided by investigators from outside the department, with a real-world analysis problem that needs to be solved to the investigator's satisfaction. (For various reasons, we have to limit that class to only about 15 students a year.) In terms of math, we require the usual multidimensional calculus and differential equations sequence, plus linear algebra; I usually try to steer my advisees to getting some exposure to Fourier analysis.
- Data grappling skills: they should know how to move data around and manipulate data with some programming language or languages.
- Data viz experience: they should know how to draw informative pictures of data. That should in fact be the very first thing they do when they encounter new data
- Knowledge of stats, errorbars, confidence intervals: ask them to explain this stuff to you. They should be able to.
- Experience with forecasting and prediction, both general and specific (ex): lots of variety here, and if you have more than one data scientist position open, I'd try to get people from different backgrounds (finance and machine learning for example) because you'll get great cross-pollination that way
- Great communication skills: data scientists will be a big part of your business and will contribute to communications with big clients.
Now take Cathy's desiderata in turn:
We could demand more programming, but as Cathy says very well,
don't confuse a data scientist with a software engineer! Just as software engineers focus on their craft and aren't expected to be experts at the craft of modeling, data scientists know how to program in the sense that they typically know how to use a scripting language like python to manipulate the data into a form where they can do analytics on it. They sometimes even know a bit of java or C, but they aren't software engineers, and asking them to be is missing the point of their value to your business.However, we are right to demand some programming. It is all very well to be able to use someone else's software, but (again, to repeat myself) "someone who just knows how to run canned routines is not a data analyst but a drone attached to a machine they do not understand"4. This is why I insist on programming in all my classes, and why I encourage my advisees to take real computer science classes.
People with certain sorts of computer science backgrounds often have these skills: machine learning, obviously, but also information retrieval, or natural language processing, or even databases. (The developments in database techniques which make this kind of work possible on an industrial scale do not get enough love.) From the perspective of someone coming from computer science, a lot of what we teach The Kids now looks a lot more like machine learning than statistics as it was taught circa 1970, or even circa 1980 5. And then of course there is signal processing, some branches of applied math, experimental physics, and so on and so forth.
So of course you don't need a statistics degree to learn these things. You
don't even need to have taken a single statistics class (though it's
taking food out of my non-existent children's mouths tuna out
of my cat's bowl for me to say so). I've never taken a statistics
class6. Everything I know
about statistics I've learned without formal instruction, from reading books,
reading papers, listening to talks, and arguing with people.
Like the rest of the applied mathematical sciences, learning the most useful parts of statistics is not, in my experience, intrinsically hard for anyone who already has a decent grounding in some other mathematical science. Or rather, the hard parts are finding good references, finding the time to tackle them, and maintaining the motivation to keep doing so, especially as mastering them really does mean trying to do things and failing, and so feeling like an idiot. (The beginner's mind fits uncomfortably, once you've out-grown it.) My job as a statistics professor, teaching classes, is to provide those references, force the time to be carved out, try to maintain the motivation, and provide feedback. But so far from wanting to discourage people who aren't statistics students from learning these things and doing data analysis, I think that they should be encouraged to do so, which is part of why I spend a lot of time and effort in working up freely-accessible teaching materials.
Now, beyond the sheer knowledge of established methods and techniques, there is, as Cathy rightly says in her follow-up post, the capacity to figure out what the important problems to solve are, and the capacity to use established principles to devise solutions — in the limit, if necessary, to establish new principles. It's easier to deal with these in reverse order.
I think we are doing our students, even at our undergrads, a profound dis-service if we do not teach them those general principles, and how canned procedures for particular cases come from them. There are books with titles like A Gazillion Statistical Tests, and they serve a role, just like the tables of emission spectra in physics handbooks, but memorizing such things is not what learning the subject is about in either field. If this is the kind of thing Cathy thinks I mean by "undergraduate statistics", then yes, she's right to say it's nowhere near enough. (And there are schools where the curriculum doesn't really go beyond training students to be human interfaces to such tables, and/or commercial software.) But I am frankly skeptical about the utility of much of what is in such references, having never had a real problem where even so much as an F-test was useful. As for the cookbook distributional assumptions of Gaussianity and the like, well, Fisher himself was quite shaken to realize that people were taking them as defaults, and there is a reason I spend so much time on non-parametrics and resampling.
The real goal, however, is not even to teach about (say) specific cross-validation techniques, but, once again, to teach about the general principles and how to use them in specific cases. I don't know of a better way, yet, of doing this than showing how I'd do it on a range of examples and helping students work through examples on their own, the more real the better. (How, after all, does one learn to set up a model in physics?) Drilling on the most abstract theoretical ideas isn't a substitute for this, since it leads to the "But, sir, what Hamiltonian should I diagonalize?" problem. The capacity to devise solutions on the basis of known principles is a kind of craft knowledge, a collection of technical habits of the mind resting on pattern recognition and heuristics, and like any such knowledge it improves strongly with feedback and practice. (ObInvocationOfLocalCultureHero: The Sciences of the Artificial is very sound on this.) Twenty-one year olds with fresh undergraduate degrees won't have ten years of practice in data analysis, but here we should have given them at least two.
The other issue Cathy raises is the capacity to formulate a good problem. Getting this right is logically prior to solving problems, and it's a key capacity of a researcher or even any skilled and autonomous professional. Sadly, it seems a lot harder to help people develop than mere problem-solving. (Good old fashioned cognitive psychology gives us pretty good accounts of problem solving; problem formulation, not so much.) Indeed, to some extent schooling-as-usual seems actively harmful, since it rewards solving what are already well-defined problems — at most, guessing what ambiguous statements mean to the graders — and not reducing a confused situation into a clear problem (and revising the formulation as necessary). Nonetheless, some people are better at problem-formulation than others, and people tend to improve with practice. (Or perhaps those who are bad find other lines of work, and this impression is a survivorship bias?) If anyone has a better idea of how to teach it than to give learners chances to formulate their own problems, and then critiquing their efforts, please let me know, because I'd find it very helpful.
Let me just add that there is something in Cathy's posts, especially the follow-up, which seem well-intentioned but potentially hazardous. This is the idea that all that really matters is being "smart" (and "nerdy"), and that if you've got that, you can pick up whatever it is you need to know. Rather than rehash the question of a one-dimensional smartness again, I will just make two observations, one anecdotal and the other more scientifically grounded.
The less-personal one invokes the work of Carol Dweck and associates about learning. Over-simplifying, what they find is that it is actually counter-productive for students to attribute their success or failure in learning about something to an innate talent, ability or knack, apparently because it makes it harder to use feedback successfully. If, after seeing that they bombed question no. 3 on the exam, a student thinks, "Wow, I guess I really don't have a head for this", well, what can they do about that? But the student who explains their failure by inadequate preparation, poor study skills, etc., has something they can work on productively. In other words, explaining outcomes by innate talent inside themselves actually seems to make success harder to achieve, by leading to neglect of other causes which they can control. There is however a role here for an unshakeable conviction on the learner's part that they are smart and nerdy enough to learn any nerdy thing, if that keeps them from falling for the "I don't have a head for this" line.
The ancedotal observation is to mount one of my hobby-horses again. Why have physicists (and others in their wake) made so many so very many dubious-to-ridiculous claims about power laws? It's not that they aren't smart enough or nerdy enough — certainly someone like Gene Stanley is a lot smarter than I am, and doing things right is just not that hard. I am pretty sure the reason is that they think smarts and physics nerdiness removes the need to learn about other fields before trying to solve their problems, which, as usual, is wrong.
Again, the last thing I want is to discourage people from learning and practicing data analysis. I think statistics is beautiful and useful and the world would be a better place if its were better known. It would be absurd to insist that only Duly Credentialed Statisticians should do it. (Some people have suggested introducing standardized certification for statisticians; I would oppose this if it seemed a serious threat.) I agree whole-heartedly with Cathy about what goes into a good "data scientist", and I am not trying to claim that any freshly-minted statistics BA (even from here) is as good as anyone now in a "data scientist" job; that would be silly. I am saying that the skills and habits of mind which go into such jobs are the ones we try to teach, I hope with some success. If people want to call those who do such jobs "data scientists" rather than "statisticians" because it sounds more dignified7, or gets them more money, or makes them easier to hire8, then more power to them. If they want to avoid the suggestion that you need a statistics degree to do this work, they have a point but it seems a clumsy way to make it. If, however, the name "statistician" is avoided because that connotes not a powerful discipline which transforms profound ideas about learning from experience into practical tools, but rather, a meaningless conglomeration of rituals better conducted with twenty-sided dice, then we as a profession have failed ourselves and, more importantly, the public, and the blame lies with us. Since what we have to offer is really quite wonderful, we should not let that happen.
1: No, am still not going to add comments. It's all I can do to write posts, never mind tending a comments section, and I know only too well what would happen if I left one alone. ^
2: If you doubt that such fossilization actually happens, observe that in 2011, a respectable academic publisher, specializing in research methods for psychology, published a book hailing confidence intervals — confidence intervals! — as "new statistics", with every appearance that they are in fact new to that audience. ^
3: I know I lifted the idea that statistics is a sort of mathematical engineering from a conversation with Andy Gelman, but he's not to blame for the use I've made of the notion. ^
4: I am classist enough to look down on someone who chooses, when they have an alternative, to be a mere fleshly interface to a dumb tool, to be enslaved by one of our own creations. Too often, of course, people have no choice in this. ^
5: On the other hand, machine learning itself was drastically transformed in the 1980s and 1990s by importing lots of ideas from statistics, ranging from cross-validation to empirical process theory. Compare, say, Tou and Gonzalez's Pattern Recognition Principles from 1974 to Ripley's Pattern Recognition and Neural Networks from 1996, and you see not just 20 years of technical development along the same lines, but really deep changes in aims and approaches, in what counts as good work on pattern recognition. (Perhaps this is why Amazon has Tou and Gonzalez categorized under "Books > History > Ancient > Early Civilization"?) This was a scientific revolution which immediately affected industrial practice, and it would be great to have a good history of it. ^
6: My own degrees are in theoretical physics, as I may have mentioned once or twice, and along the whole curriculum from shooting the monkey to entropy-driven forces between topological defects in low-temperature spin systems, there were only three classes with any statistical content. These were: (i) undergraduate physics lab, where we were taught about standard errors, propagation of error, and fitting a line through three points by least squares; (ii) a graduate "pattern recognition" class, reproducing what was taught under that heading to Russian mechanical engineers in the Brezhnev era (the names "Vapnik" and "Chervonenkis" never passing the professor's lips); and (iii) some asides on estimation in my revered probability guru's stochastic processes classes. ^
7: Similarly, if people who pick up garbage want to be called "sanitation engineers", because it makes it a bit easier to do an unpleasant and ill-paid but necessary job, why not? (It's not as though we could imagine a world where they'd have pay and dignity.) ^
8: Anecdotally, I have been told that our insane immigration system gives you an easier time if your job description says "scientist" rather than "engineer" or "analyst". I have also been told of HR departments which would object to hiring someone as "a statistician" if they don't have a statistics degree, but can't object to hiring someone as "a data scientist" to do the same job, because there are no data science degrees. (Yet.) If so, this may be the first intellectual movement which is really just regulatory arbitrage. ^
Update, next day: I should have made clear that, as usual, I'm not speaking for the CMU statistics department. Also, I'd like to thank reader R.W. for bringing @ML_hipster's "Yeah, so I'm actually a data scientist. I just do this barista thing in between gigs." to my attention. It's funny because it's a bit too cruel to be true.
28 July: Minor typo fixes, thanks to a different R.W.
31 July: A characteristically generous reply from Cathy.
Manual trackback: Flowing Data; Fernando Pereira (whose friendly amendment I happily accept); Numbers Rule Your World (deserves a response, probably won't get one anytime soon); Paperpools; Synthetic Daisies; Since it is not...
Posted by crshalizi at July 25, 2012 09:10 | permanent link
Let me very strongly recommend all the other finalists; there's some great writing there, much of it by blogs I'd never seen.
But (since I can't be fed without biting a hand), I do want to contest Sean's claim that I have such a pathological aversion to visual interest that I "use a slightly gray font on a white background, presumably because black on white would come off as too florid". This is a cat* critiquing an expansion of a Hamiltonian/log-likelihood function:
Sean's argument is invalid.
*: Nimbus "Fog" Moore.
Update, 25 July: fixed some mangled sentences, added a link to Sterling's explanation of "attention conservation notice".
Posted by crshalizi at July 03, 2012 12:55 | permanent link
Attention conservation notice: I have no taste.
Deng Xiaoping may have hoped that he could stimulate economic activity at the local level and beyond without awakening the goddess of democracy. The students of Tiananmen Square gave him the answer, and his counterblast destroyed economic initiative along with demands for political participation. [pp. 82--83]To be fair, the context of this passage is R.D. writing about how hard it is to understand all the linkages between politics and the economy...
Books to Read While the Algae Grow in Your Fur; Scientifiction and Fantastica; Enigmas of Chance; The Dismal Science; The Progressive Forces; Pleasures of Detection, Portraits of Crime; The Commonwealth of Letters; Writing for Antiquity
Posted by crshalizi at June 30, 2012 23:59 | permanent link
Incorporated by reference: Workshop on Foundations for Ockham's Razor; Ockham Workshop, Day 1; Ockham Workshop, Day 2. I am too tired to think of a Borges reference.
Deborah Mayo gave a precis of her error-statistical view of inquiry; I'm not likely to improve on my first attempt to summarize it. (Let me also plug her later paper with D. R. Cox, "Frequentist Statistics as a Theory of Inductive Inference".) As for simplicity, Mayo expressed great skepticism as to whether it has any virtues as such. The key thing, to her mind, is to probe theories in ways which expose potential faults and rule out alternatives. (She had a nice slogan summarizing this, but my hand-writing is too illegible for me to reconstruct it.) "Simplicity", in its various senses, may or may not be conducive to this; it's nice if it is, but if not, not. — It occurs to me that many of the capacity-control measures used in learning theory (Rademacher complexity, VC entropy, etc.) have a severity-ish flavor of "how easily could this model seem to work really well, even if it's rubbish?", and it would be interesting to try to make that more precise, perhaps along the lines of Balduzzi's paper on falsification and generalization error.
For the final roundtable, the speakers were supposed to take turns answering various questions posed by Kevin Kelly, beginning with "What is Ockham's Razor"? Dr. Vapnik went first, and felt compelled to stage an intervention, going to the chalk-board to remind the audience that counting parameters has almost nothing to do with over-fitting (offering support vector machines and boosting as examples), re-iterating the importance of regularizing ill-posed inverse problems and of finite-sample risk bounds, bemoaning the tendency of the statistical profession to follow Fisher's lead on parametric maximum likelihood rather than Glivenko and Cantelli's lead on non-parametric uniform convergence, and decrying the neglect of conditional density estimation. Finally, I believe he said that Ockham's Razor is at best a primitive approximation to structural risk minimization, but I am not at all sure I understood him correctly.
I spoke next, and all I can say is that Dr. Vapnik is a tough act to follow. If any consensus emerged on the nature of Ockham's Razor, it eluded me.
Miscellaneous topics: the biology of prions; how close Popper may or may not have come to defining VC dimension; how much ibuprofen can safely be taken every day; where to find a good sazerac near campus; Descartes's theological argument for the Markov property.
Once upon a time, I was involved in a project on modeling the growth of bacterial biofilms on hard surfaces, such as teeth and sewage tanks. (None of my work ended up making it into the paper, nor did it deserve to, so it wouldn't be right for me to say "we", but I know whereof I speak.) The team used what feels like a very simple model, where "food" (don't ask) diffused through the ambient medium, unless it got absorbed by bits of the bacterial film living on a hard surface; bits of film which were well-enough fed could expand onto nearby territory, or buckle up into the medium, but they died off without food. What made this simple, it seems to me, we having so few distinct processes or mechanisms in the mode. Each process also had, in the notation available, a very simple representation, but that's not really the point. But if the probability of film growth as a function of food intake had followed an arbitrary curve drawn free-hand, it probably would've taken a lot of parameters to write down as a spline, but it would still have been a simple model. (At most it would have led to statistical issues with a quantitative fit.) To make the model more complex, it would have had to incorporate other processes. For instance, the model treats all bits of biofilm as equivalent, regardless of how old it is, but it's entirely conceivable that as a bit of the film ages, there are processes of maturation (or ecological succession) which make it more or less efficient at converting food to biomass. A model which included an age-dependent "yield curve" needn't have any more adjustable parameters (the curve could be taken from a separate experiment and fixed), but it would definitely be more complex.
Now, the model didn't seem to need such a mechanism, so it doesn't have one. (In fact, I'm not sure this issue was even considered it at the time.) It's this, the leave-out-processes-you-don't-need, which seems to me the core of the Razor for scientific model-building. This is definitely not the same as parameter-counting, and I think it's also different from capacity control and even from description-length-measuring (cf.), though I am open to Peter persuading me otherwise. I am not, however, altogether sure how to formalize it, or what would justify it, beyond an aesthetic preference for tidy models. (And who died and left the tidy-minded in charge?) The best hope for such justification, I think, is something like Kevin's idea that the Razor helps us get to the truth faster, or at least with fewer needless detours. Positing processes and mechanisms which aren't strictly called for to account for the phenomena is asking for trouble needlessly — unless those posits happen to be right. There is also the very subtle issue of what phenomena need to be accounted for. (The model was silent about the color of the biofilms; why disdain that?)
To sum up, I emerge from the workshop (1) not sure that my favorite complexity measure captures the kind of complexity which is involved in the use of Occam's Razor in scientific modeling (though it might), (2) not sure that said use is an aid to finding truth as opposed to a world-building preference of those William James called "tough minded" (though it might), and (3) unsure how to connect the most promising-sounding account of how the Razor might help to actual scientific practice. In other words, I spent three days talking with philosophers, and am now more confused than ever.
There's one more post I want to write about the Razor and related topics, but there's other stuff to do before then. Once again, I'll point you to Deborah Mayo and Larry Wasserman in the meanwhile. In particular, don't miss Larry's post about the excellent talk Grünwald gave after the conference at the statistics department, about some aspects of in-consistent Bayesian inference and their remedies. It might lead to a universal form of posterior predictive checking (maybe), which would be very welcome indeed.
Posted by crshalizi at June 26, 2012 22:40 | permanent link
Incorporated by reference: Workshop on Foundations for Ockham's Razor; Ockham Workshop, Day 1; "Tlön, Uqbar, Orbis Tertius"
How could one do other than submit to Tlön, to the minute and vast evidence of an orderly plan?
The theme of the morning was that Ockham's razor is not a useful principle because the truth is inherently simple, or because the truth is apt to be simple, or because simplicity is more plausible, or even because simple models predict better. Rather, the Razor helps us get to the truth faster than if we multiplied complexities without necessity, even when the truth is actually rather complex.
There are no nouns in Tlön's conjectural Ursprache, from which the "present" languages and the dialects are derived: there are impersonal verbs, modified by monosyllabic suffixes (or prefixes) with an adverbial value. For example: there is no word corresponding to the word "moon,", but there is a verb which in English would be "to moon" or "to moonate." "The moon rose above the river" is hlor u fang axaxaxas mlo, or literally: "upward behind the onstreaming it mooned."
Oliver Schulte talked about devising learning algorithms which minimize the number of "mind changes", times when the algorithm, working incrementally through data, changes the hypothesis it outputs. (The algorithm is allowed to say "situation cloudy, try again later", but forced to converge eventually.) To do this, say that hypothesis A is simpler than hypothesis B when there are observations which will falsify A but not B, and none which falsify B but not A. For instance, "all swans are edible" is simpler than "some swans are poisonous to all mammals". (Exercise: is "some swans are poisonous to all mammals" more or less simple than "some swans are poisonous to all hedgehogs"?) Now an Ockham learner is one which outputs the simplest hypothesis compatible with the data so far, or "situation cloudy" if there are multiple viable simplest hypotheses. It's now a theorem that an Ockham learner has fewer worst-case mind-changes than any other consistent strategy. Schulte illustrated this with an example of trying to learn conserved quantities from positive examples of observed reactions among elementary particles, along these lines.
A lively discussion followed as to whether the hypothesis that "all emeralds are green" is simpler, in this sense, than "all emeralds are grue" (consensus: yes, if the data are described in the green/blue language; but no, in the grue/bleen language), and whether minimum description length approaches would fair any better (consensus: yes, but no).
The preceding applies to the languages of the southern hemisphere. In those of the northern hemisphere ... the prime unit is not the verb, but the monosyllabic adjective. The noun is formed by an accumulation of adjectives. They do not say "moon," but rather "round airy-light on dark" or "pale-orange-of-the-sky" or any other such combination. In the example selected the mass of adjectives refers to a real object, but this is purely fortuitous.
Kevin Kelly is (so far as I know) the originator of this efficient-convergence approach to the Razor, including the notion of simplicity which Schulte employed. He talked about new work on refining and extending this simplicity measure, or rather setting out a system of axioms for the "simpler than" relation. This then leads to proofs that Ockham strategies are worst-case optimal in a wide range of situations, under an array of new loss functions (beyond mind-changes). I will be honest and say that I did not follow his new axiomatic description of simplicity well enough to be able to reproduce it on a blog. It's claimed that in the new axiom system, the ordering of graphical models by simplicity exactly matches the ordering among Markov equivalence classes by inclusion of conditional independence relations, which is very interesting, but it remains unclear to me how to make the whole scheme work in a really statistical set-up (as opposed to, say, interval-valued data).
...ideal objects, which are convoked and dissolved in a moment, according to poetic needs. At times they are determined by mere simultaneity. There are objects composed of two terms, one of visual and another of auditory character: the color of the rising sun and the faraway cry of a bird. There are objects of many terms: the sun and the water on a swimmer's chest, the vague tremulous rose color we see with our eyes closed, the sensation of being carried along by a river and also by sleep. These second-degree objects can be combined with others; through the use of certain abbreviations, the process is practically infinite.
The first talk after lunch was a confused mass of equivocations as to the status of latent states (inferred? constructed?), only tenuously invoked Occam's Razor, and not especially well connected either to philosophy or to data analysis, but rather one of the most conspicuously useless areas of science.
the universe is comparable to those cryptographs in which not all the symbols are valid and that only what happens every three hundred nights is true
Hannes Leeb talked about aspects of statistical inference for regression models where which model we use is picked by model selection, instead of being given to us; he stuck to linear regression with Gaussian noise for simplicity. The first part of the talk considered the situation where the number of predictor variables is constant but the sample size \( n \) goes to infinity. Here the interesting situation is when the coefficients \( \beta \) are small, confined within a ball of radius \( O(1/\sqrt{n}) \) around the origin, since this is precisely when model selection might be most useful. (If the coefficients are much bigger than that, very crude statistics tells you what they are.) What he proved is that there are always some values of \( \beta \) inside this ball which will frustrate any attempt to even approximate the sampling distribution of post-selection estimates, for basically any model-selection procedure. Thus even trying to get confidence sets for \( \widehat{\beta} \) is hopeless.
On the other hand, he was able to give strong guarantees on the predictive performance (not parameter estimates) of reasonable model-selection estimators in the case where the number of relevant predictors is actually infinite, but \( n \rightarrow \infty \). The trick, as I understand it (there was again quite a bit of discussion) is that the bad behavior in the fixed-dimension case doesn't happen for every value of \( \beta \), but rather a set which depends on the design matrix, and becomes in some sense thinner and thinner as the dimension grows. In the infinite-dimensional case, if we just want to make predictions and don't really care about parameter estimates, it turns out to be possible to say an awful lot about the distribution of prediction errors.
The high-dimensional results rested on assuming that all predictor variables, and the response, are drawn from a single multivariate Gaussian distribution. Gaussianity was needed for two things: tight tail bounds, and getting to believe that conditional expectations are linear and conditional variances are constant. Trickier empirical process theory can substitute for Gaussian distributions as far as tail bounds go, but what about linearity and homoskedasticity?
Think of a \( d \)-dimensional random vector \( Z \) with mean zero, identity covariance , bounded densities, independent entries, take \( d \rightarrow \infty \) . Take projections \( \alpha \cdot Z \) and \( b \cdot Z \). Look at the conditional mean and variance of \( Y \equiv \alpha \cdot Z \) given \( X \equiv \beta \cdot Z \). Hold \( \alpha \) fixed and ask whether \( \beta \) is such that (i) \( \mathbb{E}[Y|X] \) is linear in \( X \), and (ii) \( \mathbb{V}[Y|X] \) is constant in \( X \), so that we can write \( Y = bX + U \), with \( U \) uncorrelated and homoskedastic noise, even though the true data-generating process is \( Y = \alpha \cdot Z \). It turns out that for each \( \alpha \), if we pick \( \beta \) uniformly over the unit sphere, the probability that (i) and (ii) hold, at least to within \( \pm \epsilon \), tends to 1 as \( d \rightarrow \infty \), no matter how small we make \( \epsilon \). This extends to multiple projections on the "right-hand side", i.e., \( X_1 = \beta_1 \cdot Z, X_2 = \beta_2 \cdot Z, \ldots \). This suggests that the assumptions needed for the high-dimensional model-selection results to work well are actually fairly generic, and not really tied to Gaussianity.
I shall venture to request a few minutes to expound its concept of the universe...
Malcolm Forster tried to explicate some historical uses of Occam's Razor (not called that then) from Copernican Revolution. He began with the observation that essentially arbitrary curves can be approximated to arbitrary position by means of piling enough epicycles together (see, e.g.), which is just Fourier analysis (or perhaps, in light of priority, Tusi analysis). But Copernicus was just as much about piling epicycles on the basic circle as any Ptolemaic model, so why (if at all?) was Copernicus better?
One way was not just epicycle counting, but epicycle-coincide counting. Take your favorite Copernican, heliocentric model, with some finite number of epicycles. For each planet, there is a Ptolemaic, geocentric sub-model which can match the predicted motion of that planet (to arbitrary accuracy). However, if the same Ptolemaic model is to match the behavior of multiple planets, the Ptolemaic model is going to demand more epicycles. Worse, it is going to demand an otherwise-pointless coincidence among the epicycles of different planets. If we take a Copernican model with the Earth, Mars and Jupiter all going in circles around the Sun, it can be matched by a Ptolemaic model in which the Sun circles the Earth, and Mars and Jupiter circle the Earth with one epicycle each. But the period of the Sun's circle around the Earth must match those of the epicycles of Mars and Jupiter --- basically, every planet must get an epicycle which replicates the Earth's orbit. (If I followed Forster right, this point was made by Kepler, not Copernicus.) Forster imagined a "data-driven Ptolemaic astronomer, 'Ptolemy+' " — though surely that should be "Ptolemy++"? — who, on model-selection grounds (e.g., AIC), preferred using a geocentric model where those three circles had to have the same period. Ptolemy++ would give the same predictions for the positions of the planets in the sky as Copernicus, but would have no physical explanation for the parameter coincidence, or any ability to explain why (as was known at the time of Copernicus) the outer planets seem to go into retrograde motion only when opposed to the Sun, or why the inner planets show phases (which wasn't known until the telescope). Taking the Copernican model realistically, rather than the instrumentalist Ptolemy++, would have been (was?) more fruitful.
I will not attempt to summarize what Forster said about the contrast between Copernican epicycles and Kepler's ellipses, or Newton's unification of Kepler and Galileo. I was struck by the observation that when Newton talked about "causes" and "effects", he didn't mean events or even variables, but something more like (what we would call) mechanisms (for causes) and phenomena (for effects). Also, there's evidently a passage in the Principia which is evidently a near-quotation of Occam's own Frustra fit per plura quod potest fieri per pauciora, "it is vain to do with more what could be done with less".
There followed another heated discussion, of whether machine learning algorithms could have discovered heliocentricity.
it has been established that all works are the creation of one author, who is atemporal and anonymous. The critics often invent authors: they select two dissimilar works — the Tao Te Ching and the 1001 Nights, say — attribute them to the same writer and then determine most scrupulously the psychology of this interesting homme de lettres...
The theory of giving driving directions; whether an independent and identically-distributed sequence is simpler than a homogeneous Markov chain, or vice versa; whether a physical theory that makes many very detailed assertions is simple or complex; parsimony as an argument for panpsychism; the lasso's grue problem; Galileo's surprisingly-persuasive thought experiment for spherical inertia; why Kepler had noisier (but not smaller) residuals than Ptolemy; whether Ptolemy++ should have used AIC or the lasso.
Posted by crshalizi at June 23, 2012 23:59 | permanent link
Those incorporated by reference: Workshop on Foundations for Ockham's Razor; "The Analytical Language of John Wilkins"
Those that belong to the emperor: The morning's first speaker was Vladimir Vapnik, who made fundamental contributions to machine learning from the 1970s through the 1990s. Reading his book The Nature of Statistical Learning Theory is one of the reasons I became a statistician. This was the first time I'd heard him speak. No summary I could give here would do justice to the unique qualities of his presentation.
Those that are trained: Peter Grünwald talked about the role of results which look very much like Bayesian posteriors, but make no sense within the Bayesian ideology, in deriving data-dependent bounds on the regret or risk of predictors. This material drew on the discussion of "luckiness" in his book on The Minimum Description Length Principle. At the risk of distorting his meaning somewhat, I'd say that the idea here is to use a prior or penalty which deliberately introduces a bias towards some part of the model space. The bias stabilizes the predictions, by reducing variance, but the bias isn't so big as to produce horrible results when reality (or the best-approximation-to-reality-within-the-model-space) doesn't line up with the bias. This leads to an Occam-like result because it is very hard to design priors or penalties which obey the Kraft inequality and don't bias the learner towards smaller models --- that don't give first-order Markov chains, for instance, more weight than second-order chains. More exactly, you can design perverse priors like that, but then there are always non-perverse (healthy?) priors which have uniformly tighter performance bounds.
Those drawn with a very fine camel-hair brush: Larry Wasserman talked about the need to pick control settings and how, despite what we keep telling students, we don't really have an entirely satisfactory way of doing this, a point which was graphically illustrated with some instances of cross-validation consistently picking models which were "too large" --- too many variables in Lasso regression, too many edges in graph inference, etc. Part of the problem is that CV error curves typically are asymmetric, with a very sharp drop-off as one gets rid of under-fitting by including more complexity, and then a very shallow rise as complexity increases. Larry hinted st some ideas for taming this, by testing whether an apparent improvement in CV from extra complexity is real, but had no strong solution to offer, and ended up calling for a theory of when and how we should over-smooth.
Those that resemble flies from a distance: Elliott Sober closed out the first day by trying to explicate two examples. The first (one which he spent less time) was why, when two students turn in exactly the same essay, we regard it as more plausible that they both copied from a common source, as opposed to their just happening to produce the exact same string of words. He mentioned Wesley Salmon, and Reichenbach's Common Cause Principle, but not, sadly, "Pierre Menard, Author of Don Quixote". Sober devoted more attention, however, to issues of parsimony in phylogenetics, where one of the most widely used techniques to reconstruct the state of ancestral organisms is to posit the smallest number and size (in some sense) of changes from the ancestor to its descendants, taking into account that some of the descendants may have more recent common ancestors. Thus humans and chimpanzees are more closely related to each other than to gorillas; since humans alone have opposable thumbs, the minimum-parsimony inference is that the common ancestor did not, and thumbs evolved once, rather than being lost on two separate occasions. (Such reasoning is also used, as he said, to figure out what the best tree is, but he focused on the case where the tree is taken as given.) What he mostly addressed is when parsimony, in this sense, ranks hypotheses in the same order as likelihood. (He did not discuss when parsimony leads to accurate inferences.) The conditions needed for parsimony and likelihood to agree are rather complicated and disjunctive, making parsimony seem like a mere short-cut or hack — if you think it should be matching likelihood. He was, however, clear in saying that he didn't think hypotheses should always be evaluated in terms of likelihood alone. He ended by suggesting that "parsimony" or "simplicity" is probably many different things in many different areas of science (safe enough), and that when there is a legitimate preference for parsimony, it can be explained "reductively", in terms of service to some more compelling goal than sheer simplicity.
Those that are included in this session classification: optical character
recognition; Statistical
Modeling: The Two Cultures; falsification (in at least two different
senses); at least three different distinctions between "induction" and
"deduction"; cladistics;
Kant's Critique
of Judgment; instrumentalism; gene expression data;
cross-validation; why all machine learning assumes stationary data; machine
learning results which do not rely on
stationarity; Chow-Liu
trees.
Fabulous ones, or perhaps stray dogs: classical statisticians (as described by several speakers).
Those that tremble as if they were mad with eagerness
to help
participants: Maximum
Likelihood, an
Introduction; Conditioning,
Likelihood, and
Coherence; Prediction,
Learning, and
Games; The
Role of Ockham's Razor in Knowledge Discovery;
Falsification and future performance
And now, if you'll excuse me, I need more drinks to revise
my slides for tomorrow. If you really must know more,
see Larry,
or Deborah Mayo.
Update, next morning: disentangled some snarled sentences.
Manual trackback: Organizations and Markets
Posted by crshalizi at June 22, 2012 22:27 | permanent link
Larry Wasserman is blogging (again), and anyone who finds my writings interesting would do better to read his.
Larry's latest post is a call for the biggest unsolved problems in statistics and machine learning. As he says, the current Wikipedia page on unsolved problems in statistics is not what he's looking for, as all the examples are either "boring", "interesting but vague", or silly (or, as he puts it, "you've got to be kidding"). As he says, a good big problem is one which can be stated succinctly, can be explained to a non-specialist, and "when you explain it to someone they think it is cool, even if they don't know what you are talking about".
I am not sure that any of these really qualify, because they're all less sexy than the "P=NP", or Navier-Stokes problems Larry has in mind from other disciplines. But they're ones which bug me, and seem like they might have more leverage than (save me) checking admissibility of some point estimate or another. I have some ideas about some of them, but hopefully my collaborators will not regard me as setting us up to be scooped by mentioning the problems. And if you know of solutions to any of these, please do tell.
Something which is definitely too vague would be "when, if ever, is parsimony a good guide to choosing between models?". So that's what I'll be talking about for the next few days.
Update, next day: Fixed some typos, added some missing links, added one problem at the end.
Update, 1 July: Simply Statistics was nice enough to link to this, observing that most (I'd say all) of these problems are "category 1" in their three-part scheme, motivated by internal considerations from statistics. I don't think any are motivated by convenient data sets (their category 2), or pressing scientific questions (category 3). For the record I think that's unfortunate; it's problems in the last category, where there's an actual issue about the world we need to resolve, which matter most. (Their "category 2" seems like exercises — perhaps very difficult exercises.) But for better or for worse, it's a lot easier for me to think of problems in the first category. What gives those problems their interest, though, is the hope that they could be used to answer lots of third-category questions...
Posted by crshalizi at June 21, 2012 23:09 | permanent link
Attention conservation notice: Is there any form more dreary than a response to comments?
Thanks, once again, for the very gratifying response. Mostly I want to reply to criticism, because I have little constructive to say, as usual. So I will pass over Scott Martens, and Peter Dorman, and David Childers, and many others.
Plans Happen I should re-iterate that Kantorovich-style planning is entirely possible when the planners can be given good data, an unambiguous objective function, and a problem of sufficiently limited scope. Moreover, what counts as "sufficiently limited" is going to grow as computing power does. The difficulties are about scale, not principle; complexity, not computability.
Probably more importantly, there are other forms of control, with good claims on the name "planning", which are not this sort of mathematical programming, and plausibly have much lower computational complexity. (Central banks, for instance, are planning bodies which set certain prices.) In particular, intervening in existing market institutions, or capitalist firms, or creating non-market institutions to do things — none of these are subject to the same critique as Kantorovich-style planning. They may have their own problems, but that's a separate story. I should have been clearer about this distinction.
Let me also add that I focused on the obstacles in the way of planning because I was, at least officially, writing about Red Plenty. Had the occasion for the post been the (sadly non-existent) Red, White, and Blue Plenty, it would have been appropriate to say much more about the flaws of capitalism, not just as we endure it but also it in its more idealized forms.
"Shalizi's discovery of Sweden" I took it to be obvious that what I was advocating at the end was a rather old-fashioned social democracy or market socialism — what Robert Heilbronner used to call a "slightly imaginary Sweden". The idea that the positions I like are at all novel would be silly. It is also something which I evidently failed to convey clearly, given the responses by Gordon and Tim Wilkinson.
For the record, I think it is a horrid mistake to think or act as though the level of inequality is constant, or that current institutional arrangements within capitalism are either unalterable or very good. I also think that spending thirty years deliberately dismantling safe-guards, out of a mixture of ideology and greed, was criminal folly. Red White and Blue Plenty would also have a lot to say about economists' dreams — and their zombies — and the effects of chasing those dreams.
I don't see, though, that it's so obvious how to make things better now. It's pretty clear, I hope, that defined-contribution, 401(k), retirement plans have been a colossal failure (except for the financial industry, for whom they present a steady flow of dumb money), but going back to the sort of defined-benefit plan which presumes long-term employment by a single stable firm is also a non-starter. (Indeed the one good thing about 401(k)'s was that they didn't tie workers to one firm.) I'm not saying there's no solution, but if there's an obvious fix I don't see it. Or, again, the inequalities in public education in this country are obscene, and make a mockery of even stated conservative ideals, but even if we swept away obstacles like local and state school boards, funding from local property taxes, etc., is it really clear what a better system, that works under modern American conditions, would be? That we'd get it right the very first time? Or, saving the most important for last, does anyone seriously want to say that coming up with viable institutions to strengthen workers' bargaining power is straightforward? That just doing what the CIO did in the '30s will work again? There has been a very concerted, and dubiously legal, effort to crush unions and the labor movement, and stopping that has got to be a step in the right direction, but beyond that?
Turning to Wilkinson. I cheerfully accept correction that profit is not the only unambiguous objective function which could guide planners; that was sloppy writing on my part. And I would be very happy to see firms and other centers of power and planning brought under more democratic control; generally speaking, the exercise of power should be accountable to those over whom it is wielded. (Though there is a real potential for conflict here between democratic control by workers in a particular enterprise and the people at large: I don't know how we ought to deal with that.) But beyond that... Look, I didn't make up "shadow prices"; that's standard terminology, though if you don't like it, feel free to read "objectively-determined valuations", or even "Lagrange multipliers", throughout. Perhaps-relatedly, I fail to see how token distribution, with tokens exchanged for goods and services, is not a market — indeed not commodity production. (Again, there has to be a reason for production to shift to match patterns of demand, or else we don't have a feedback loop, we have blinkenlights.) If there's a distinction there, what is it? And what would be the general term which embraces markets and the institutionalized-exchange-of-tokens-for-goods-which-is-not-a-market? Decentralized planning sounds nice — though it was not what was being discussed in Red Plenty but inevitably those plans are going to have to be coordinated. How? Processes of bilateral or multilateral mutual adjustment are going to have lots of the features of markets — again, I'm not going to insist that this could only be done through markets — but the alternative would seem to be central authority.
Cockshott, and More Equations The most important issue raised, I think, was the claim that Cockshott has shown that central planning is computationally tractable after all. I don't agree, but unfortunately, there's going to need to be a bit more math.
The linear programming problem is \[ \DeclareMathOperator*{\argmax}{argmax} \argmax_{\mathbf{C}y \leq x}{\left( v \cdot y \right)} \] where \( x \) is the (given, known) vector of available inputs or resources, \( \mathbf{C} \) is the (given) matrix of constraints (including the production technologies), \( v \) is the (given) vector of relative values of outputs, \( y \) is the (unknown, sought-for) vector of outputs. The inequality \( y \leq \mathbf{C}x \) is to be "taken componentwise", i.e., each component of \( \mathbf{C}y \) must be less than or equal to the corresponding component of \( x \). The idea is that \( \mathbf{C} \) encodes facts like "each diaper need so much fabric, machine time, electricity, labor time, etc." to make. Through the magic of Lagrange multipliers, this constrained maximization is equivalent to the unconstrained maximization \[ \argmax_{y, \lambda} {\left( v\cdot y - \lambda\cdot \left( \mathbf{C}y-x\right) \right)} \] where now the vector \( \lambda \) contains the Lagrange multipliers, a.k.a. shadow prices, a.k.a. objectively determined valuations, for each of the constraints. The problem is to figure out what we ought to make and how we ought to make it, which depends on the values we assign to different goods, the resources we have, and the different ways those resources can be used to make stuff we want.
When I talked about the complexity of solving the planning problem, I was talking about the complexity of this linear programming problem, and I was allowing for it to be solved only up to an accuracy of \( \pm \epsilon \) — the solution only had to come to within \( \epsilon \) of the optimum, and in fact only to within \( \epsilon \) of satisfting the constraints. Since the computational complexity of doing so only grows proportionally to \( \log{1/\epsilon} \), however, if we can do this at all we can ask for very good approximations. Or, pessimistically, if some other part of the problem, like the number of variables, is demanding lots of resources, we'd have to make the slop \( \epsilon \) (literally) exponentially larger to make up for it.
(Incidentally, one issue which was not explicitly raised, but which I should have mentioned, was the possibility of replacing approximate optimization with satisficing, say taking the first plan where the value of the output was above some threshold, say \( T \), and all constraints were met. [This would still leave the computational-political problem of coming up with the value vector \( v \).] I have been unable to discover any literature on the complexity of linear satisficing, but I suspect it is no better than that of approximate linear programming, since you could use the former as a sub-routine to do the latter, by ratcheting up the threshold \( T \), with each satisficing Plans as the starting-point for the next round of the ratchet.)
And so to Cockshott. I have not had a chance to read Toward a New Socialism, but I have read his 1990 paper, and I'm underwhelmed. It is not about solving the planning problem. Rather, it is about solving a simple system of linear equations, \[ \mathbf{A}x = y \] where again \( y \) is the vector of desired outputs, which he takes to be given, \( \mathbf{A} \) is a known and completely linear production technology, and \( x \) is the unknown vector of resources required, not available. His claim is that if the number of non-zero entries in \( \mathbf{A} \) is small, averaging \( k \) per row, then \( x \) can be found, to within an accuracy of \( \pm \epsilon \), in a time on the order of \( kn \log{1/\epsilon} \).
I have no doubt that it is possible to do this, because iterative algorithms for solving sparse systems of linear equations, with precisely this complexity, have been known since the work of Jacobi, and of Gauss and Seidel, in the early 19th century. (This is not mentioned in his 1990 paper, but does show up in some later ones.) The basic procedure is to start with some random guess at \( x \), say \( x_0 \), calculate \( \mathbf{A} x_0 \), and see how that compares to \( y \). The vector of "residuals", \( \mathbf{A} x_0 - y \), is used to adjust the initial guess to some \( x_1 \) which should be closer to the desired solution, \( \| x_1 - x\| \leq \| x_0 - x \| \). The cycle is then repeated with \( x_1 \), until the program either hits an exact solution or gets tired. The many different algorithms of this form all differ somewhat in details, but share this general flavor, and most have the property that if \( \mathbf{A} \) is not too ugly, then each iteration brings the approximation closer to the solution by at least a constant factor, \[ \| x_{t+1} - x \| \leq \kappa \| x_t - x\| ~, ~ \kappa < 1 \] — this where the \( \log{1/\epsilon} \) comes from, not information theory. Specifically, Cockshott's algorithm seems like a variant of Jacobi's, though with an un-necessary asymmetry between how positive and negative residuals are handled, and a quite superfluous step of sorting the variables in order of how big their residuals are.
For Cockshott's algorithm, or any other linear solver, to be of real relevance here, we need to presume that
What is bad is completely assuming away having to chose what to make and having to chose how to make it. Kantorovich was not, after all, led to consider the allocation of production across alternative techniques through idle mathematical whims, but because of real, concrete problems facing industry --- and such problems keep coming up, which is why linear programming got re-invented in the West. (And it does no good to say "well, just use the most efficient technique for everything", because, unless there is a technique which uses less of every input than all its competitors, "efficiency" is going to depend on the relative values of inputs.) Once we realize this, the attempt to replace linear programming with merely solving a system of linear equations collapses.
To sum up, what Cockshott has done is reminded us that it's (sometimes) not that hard to add up all the resources the plan calls for, once we have the plan. This adding-up is at best one step which will have to be repeated many, many times in order to come up with the plan. To think that adding-up was the hard part of mathematical planning is, and I use the words deliberately, preposterously optimistic.
(To be fair, Cockshott also has some later papers where he states the optimization problem properly, but does not go into its complexity, or the fact that it's significantly higher than that of just solving a linear system.)
Parallelism is very important, and it's what distinguishes what you can do with a (modern) supercomputer as opposed to a (modern) desktop, much more than raw clock speeds. To the best of my knowledge — and I would be very happy to be wrong here, because it would really help with my own work — to get any real speed-up here easily, your constraint matrix \( \mathbf{C} \) needs to be not just sparse, but also very specially structured, in ways which have no particular plausibility for economic problems. (Those kinds of structure have a lot of plausibility for linear problems coming from finite-scale approximations to continuous mechanical engineering problems, however.) If your matrix is sparse but unstructured, your best hope is to treat it as the adjacency matrix of a graph, and try to partition the graph into weakly-coupled sub-graphs. (Since I keep coming back to Herbert Simon, this is his "near decomposability".) Finding such a partition is, itself, ahard computational problem. The slides by Gondzio, referred to by Keshav, are about fast parallelism of linear programming problems under the assumption not just that such a decomposition exists, but that it's already known (slides 15ff). It's very cool that so much can be done when that's the case, but it doesn't seem to address the our problem.
Of course, if we have such a decomposition, each processor becomes its own center of calculation and control, as I alluded to, and we need to worry about coordinating these centers. Which brings us back to where we were before.
Stafford Beer and Allende's Chile I don't know enough to have an opinion about what was tried, or what its prospects might have been, in the absence of Pinochet and the CIA. The little of Beer I have read was not particularly impressive, but no real basis for judgment.
Innovation This is obviously hugely important, but I didn't say anything about it because I really don't understand it well enough. There's no question that the economies of the capitalist core have been very good at developing and applying new technologies. It's also obvious that governments have been intimately involved in this every step of the way, developing specific technologies (e.g., GPS, for fighting the Cold War), demanding specialized products with no immediate commercial need whose development led to huge spill-overs (e.g., microelectronics, for fighting the Cold War), etc. More generally, if all resources are efficiently devoted to meeting current needs, there is no slack available to waste on developing new things, especially as any development process is going to involve dead ends.
Now whether this can only be arranged by giving a slightly-random selection of inventors really huge pools of money after the fact is not at all clear. If they do need to be motivated by rewards, above some level of personal comfort, what more money provides is bragging rights and adulation. Might this not come as well from medals and prizes as from money? On top of this, if we take people like this at their word, they are obsessive control freaks who are driven to do their jobs. But if they're intrinsically motivated, they don't need to be paid so much...
Post-Scarcity For the linear-programming objective function, \( v^T y \), we need some constraints, or else the optimum is going to be "produce infinitely much of everything". And at least some of those constraints will have to be active, to "bite", to keep the solution from going off to infinity, which means non-zero (shadow) prices for at least some things. We could imagine, however, replacing this objective function with one which allows for satiation: over the five year plan, you can only eat so many beets, drink so much quince brandy, drive so many cars, wear so many coats, need so many hours of baby-sitting. If the objective function can be satiated within the constraints of available resources and technologies, then all of the shadow prices go to zero exactly. There would still be an allocation problem, that of assigning the resources to production processes to make sure enough was made to satiate demand. (This is what Cockshott mistakes for the planning problem.) But once that was taken care of everyone could just take what they liked.
I don't see anything self-contradictory in this vision. It does seem to either presume complete automation, to the point of AI, or being able to count on volunteered human labor. But it's thoroughly conceivable, if the objective function satiates.
This brings me to non-market signals. I think it would be a very good thing to have many different ways of getting feedback from consumers to producers about what to make and how, beyond the market mechanism. (If not nothing else, markets as institutions would be healthier for the competition.) So the suggestion by "Nobody" that "every good Web 2.0 site is a non-pricing/market solution to revealing preferences" is quite interesting. But it seems to rest on a number of peculiarities of online informational goods, namely that the opportunity costs of producing one more copy for anyone who wants one is almost (though not quite) zero. (Copying takes very few resources, my using my copy doesn't interfere with you using yours, etc.) The answer to "how many copies of this document (movie, song, optimization suite) should we make?" is therefore "as many as people want". The real question is rather "what should people pay attention to?", and there non-market signals about what other people have found worthwhile can be very helpful indeed. (Though, like everything else, they have their own weird failure modes, without even getting into spam.) Approaching this point is very positive.
Does this close the loop, to get us more of what people value and less of what they don't? Not on its own, I don't think. People who like receiving this sort of attention will respond to it, but you can't eat attention, and producing content in the first place is costly. The resources to support production have to come from somewhere, or else it will be hard for people to respond to attention. (This is a version of Maynard Handley's point that there people need to have reasons to respond to feedback signals, and capacity to do so.) For some time now the capitalist solution has been intellectual property, i.e., abandoning free markets and economic efficiency; that, and/or advertising. But there are many other possibilities. We could accept amateurism, people producing these goods in the time left free from their day-jobs. We could also try patronage, perhaps distributed from many patrons, or creating jobs where some production is part of the normal duties, even though the output isn't sold (as in science). Doubtless there are yet other ways of organizing this.
I don't see how to adapt any such system to providing tomatoes, or haircuts, or tractors, where, at least for the foreseeable future, the opportunity costs of producing one more unit are very much larger than zero. To repeat a point from the original post, we already allocate some services with positive cost along non-market lines, and rightly so (e.g., the services of the public schools, the police, the fire department, ...). All the examples like this I can think of are ones where we need (and employ) very little feedback. We can and should explore more options for providing other goods and services along such lines. We should also explore non-market modes of signaling, but collaborative filtering is not such a mode, though it might end up being part of one.
Manual trackback: Brad DeLong
The Dismal Science; The Progressive Forces; Automata and Calculating Machines
Posted by crshalizi at June 15, 2012 07:05 | permanent link
Attention conservation notice: I have no taste. Also, two weeks late.
Books to Read While the Algae Grow in Your Fur; Scientifiction and Fantastica; Automata and Calculating Machines; Pleasures of Detection, Portraits of Crime; Enigmas of Chance; The Dismal Science; The Progressive Forces;
Posted by crshalizi at May 31, 2012 23:59 | permanent link
Attention conservation notice: Over 7800 words about optimal planning for a socialist economy and its intersection with computational complexity theory. This is about as relevant to the world around us as debating whether a devotee of the Olympian gods should approve of transgenic organisms. (Or: centaurs, yes or no?) Contains mathematical symbols but no actual math, and uses Red Plenty mostly as a launching point for a tangent.Cross-posted at Crooked Timber, as part of the seminar on Red Plenty. That version has uglier math, but allows comments.
For ZMS.
There's lots to say about Red Plenty as a work of literature; I won't do so. It's basically a work of speculative fiction, where one of the primary pleasures is having a strange world unfold in the reader's mind. More than that, it's a work of science fiction, where the strangeness of the world comes from its being reshaped by technology and scientific ideas --- here, mathematical and economic ideas.
Red Plenty is also (what is a rather different thing) a work of scientist fiction, about the creative travails of scientists. The early chapter, where linear programming breaks in upon the Kantorovich character, is one of the most true-to-life depictions I've encountered of the experiences of mathematical inspiration and mathematical work. (Nothing I will ever do will be remotely as important or beautiful as what the real Kantorovich did, of course.) An essential part of that chapter, though, is the way the thoughts of the Kantorovich character split between his profound idea, his idealistic political musings, and his scheming about how to cadge some shoes, all blind to the incongruities and ironies.
It should be clear by this point that I loved Red Plenty as a book, but I am so much in its target demographic1 that it's not even funny. My enthusing about it further would not therefore help others, so I will, to make better use of our limited time, talk instead about the central idea, the dream of the optimal planned economy.
That dream did not come true, but it never even came close to being implemented; strong forces blocked that, forces which Red Plenty describes vividly. But could it even have been tried? Should it have been?
Let's think about what would have to have gone in to planning in the manner of Kantorovich.
It was no accident that mathematical optimization went hand-in-hand with automated computing. There's little point to reasoning abstractly about optima if you can't actually find them, and finding an optimum is a computational task. We pose a problem (find the plan which maximizes this objective function subject to these constraints), and want not just a solution, but a method which will continue to deliver solutions even as the problem posed is varied. We need an algorithm.
Computer science, which is not really so much a science as a branch of mathematical engineering, studies questions like this. A huge and profoundly important division of computer science, the theory of computational complexity, concerns itself with understanding what resources algorithms require to work. Those resources may take many forms: memory to store intermediate results, samples for statistical problems, communication between cooperative problem-solvers. The most basic resource is time, measured not in seconds but in operations of the computer. This is something Spufford dances around, in II.2: "Here's the power of the machine: that having broken arithmetic down into tiny idiot steps, it can then execute those steps at inhuman speed, forever." But how many steps? If it needs enough steps, then even inhuman speed is useless for human purposes...
The way computational complexity theory works is that it establishes some reasonable measure of the size of an instance of a problem, and then asks how much time is absolutely required to produce a solution. There can be several aspects of "size"; there are three natural ones for linear programming problems. One is the number of variables being optimized over, say \( n \). The second is the number of constraints on the optimization, say \( m \). The third is the amount of approximation we are willing to tolerate in a solution --- we demand that it come within \( \epsilon \) of the optimum, and that if any constraints are violated it is also by no more than \( \epsilon \). Presumably optimizing many variables ( \( n \gg 1 \) ), subject to many constraints ( \( m \gg 1 \) ), to a high degree of approximation ( \( \epsilon \ll 1 \) ), is going to take more time than optimizing a few variables ( \( n \approx 1 \) ), with a handful of constraints ( \( m \approx 1 \) ), and accepting a lot of slop ( \( \epsilon \approx 1 \) ). How much, exactly?
The fastest known algorithms for solving linear programming problems are what are called "interior point" methods. These are extremely ingenious pieces of engineer, useful not just for linear programming but a wider class of problems called "convex programming". Since the 1980s they have revolutionized numerical optimization, and are, not so coincidentally, among the intellectual children of Kantorovich (and Dantzig). The best guarantees about the number of "idiot steps" (arithmetic operations) they need to solve a linear programming problem with such algorithms is that it's proportional to \[ (m+n)^{3/2} n^2 \log{1/\epsilon} \] (I am simplifying just a bit; see sec. 4.6.1 of Ben-Tal and Nemirovski's Lectures on Modern Convex Optimization [PDF].)
Truly intractable optimization problems — of which there are many — are ones where the number of steps needed grow exponentially 2. If linear programming was in this "complexity class", it would be truly dire news, but it's not. The complexity of the calculation grows only polynomially with \( n \), so it falls in the class theorists are accustomed to regarding as "tractable". But the complexity still grows super-linearly, like \( n^{3.5} \). Expanding the problem size by a factor of a thousand takes us not a thousand times as long, but about 30 billion times as long. Where does this leave us?
A good modern commercial linear programming package can handle a problem
with 12 or 13 million variables in a few minutes on a desktop machine. Let's
be generous and push this down to 1 second. (Or let's hope that
Moore's Law rule-of-thumb has six or eight iterations left,
and wait a decade.) To handle a problem with 12 or 13 billion variables then
would take about 30 billion seconds, or roughly a thousand years.
Naturally, I have a reason for mentioning 12 million variables:
In the USSR at this time [1983] there are 12 million identifiably different products (disaggregated down to specific types of ball-bearings, designs of cloth, size of brown shoes, and so on). There are close to 50,000 industrial establishments, plus, of course, thousands of construction enterprises, transport undertakings, collective and state forms, wholesaling organs and retail outlets.This 12 million figure will conceal variations in quality; and it is not clear to me, even after tracking down Nove's sources, whether it included the provision of services, which are a necessary part of any economy.
-- Alec Nove, The Economics of Feasible Socialism (p. 36 of the revised [1991] edition; Nove's italics)
Let's say it's just twelve million. Even if the USSR could never have invented a modern computer running a good LP solver, if someone had given it one, couldn't Gosplan have done its work in a matter of minutes? Maybe an hour, to look at some alternative plans?
No. The difficulty is that there aren't merely 12 million variables to optimize over, but rather many more. We need to distinguish between a "coat, winter, men's, part-silk lining, wool worsted tricot, cloth group 29--32" in Smolensk from one in Moscow. If we don't "index" physical goods by location this way, our plan won't account for the need for transport properly, and things simply won't be where they're needed; Kantorovich said as much under the heading of "the problem of a production complex". (Goods which can spoil, or are needed at particular occasions and neither earlier nor later, should also be indexed by time; Kantorovich's "dynamic problem") A thousand locations would be very conservative, but even that factor would get us into the regime where it would take us a thousand years to work through a single plan. With 12 million kinds of goods and only a thousand locations, to have the plan ready in less than a year would need computers a thousand times faster.
This is not altogether unanticipated by Red Plenty:
A beautiful paper at the end of last year had skewered Academician Glushkov's hypercentralized rival scheme for an all-seeing, all-knowing computer which would rule the physical economy directly, with no need for money. The author had simply calculated how long it would take the best machine presently available to execute the needful program, if the Soviet economy were taken to be a system of equations with fifty million variables and five million constraints. Round about a hundred million years, was the answer. Beautiful. So the only game in town, now, was their own civilised, decentralized idea for optimal pricing, in which shadow prices calculated from opportunity costs would harmonise the plan without anyone needing to possess impossibly complete information. [V.2]
This alternative vision, the one which Spufford depicts those around Kantorovich as pushing, was to find the shadow prices needed to optimize, fix the monetary prices to track the shadow prices, and then let individuals or firms buy and sell as they wish, so long as they are within their budgets and adhere to those prices. The planners needn't govern men, nor even administer things, but only set prices. Does this, however, actually set the planners a more tractable, a less computationally-complex, problem?
So far as our current knowledge goes, no. Computing optimal prices turns out to have the same complexity as computing the optimal plan itself 3. It is (so far as I know) conceivable that there is some short-cut to computing prices alone, but we have no tractable way of doing that yet. Anyone who wants to advocate this needs to show that it is possible, not just hope piously.
How then might we escape?
It will not do to say that it's enough for the planners to approximate the optimal plan, with some dark asides about the imperfections of actually-existing capitalism thrown into the mix. The computational complexity formula I quoted above already allows for only needing to come close to the optimum. Worse, the complexity depends only very slowly, logarithmically, on the approximation to the optimum, so accepting a bit more slop buys us only a very slight savings in computation time. (The optimistic spin is that if we can do the calculations at all, we can come quite close to the optimum.) This route is blocked.
Another route would use the idea that the formula I've quoted is only an upper bound, the time required to solve an arbitrary linear programming problem. The problems set by economic planning might, however, have some special structure which could be exploited to find solutions faster. What might that structure be?
The most plausible candidate is to look for problems which are "separable", where the constraints create very few connections among the variables. If we could divide the variables into two sets which had nothing at all to do with each other, then we could solve each sub-problem separately, at tremendous savings in time. The supra-linear, \( n^{3.5} \) scaling would apply only within each sub-problem. We could get the optimal prices (or optimal plans) just by concatenating the solutions to sub-problems, with no extra work on our part.
Unfortunately, as Lenin is supposed to have said, "everything is connected to everything else". If nothing else, labor is both required for all production, and is in finite supply, creating coupling between all spheres of the economy. (Labor is not actually extra special here, but it is traditional4.) A national economy simply does not break up into so many separate, non-communicating spheres which could be optimized independently.
So long as we are thinking like computer programmers, however, we might try a desperately crude hack, and just ignore all kinds of interdependencies between variables. If we did that, if we pretended that the over-all high-dimensional economic planning problem could be split into many separate low-dimensional problems, then we could speed things up immensely, by exploiting parallelism or distributed processing. An actually-existing algorithm, on actually-existing hardware, could solve each problem on its own, ignoring the effect on the others, in a reasonable amount of time. As computing power grows, the supra-linear complexity of each planning sub-problem becomes less of an issue, and so we could be less aggressive in ignoring couplings.
At this point, each processor is something very much like a firm, with a scope dictated by information-processing power, and the mis-matches introduced by their ignoring each other in their own optimization is something very much like "the anarchy of the market". I qualify with "very much like", because there are probably lots of institutional forms these could take, some of which will not look much like actually existing capitalism. (At the very least the firm-ish entities could be publicly owned, by the state, Roemeresque stock-market socialism, workers' cooperatives, or indeed other forms.)
Forcing each processor to take some account of what the others are doing, through prices and quantities in markets, removes some of the grosser pathologies. (If you're a physicist, you think of this as weak coupling; if you're a computer programmer, it's a restricted interface.) But it won't, in general, provide enough of a communication channel to actually compute the prices swiftly — at least not if we want one set of prices, available to all. Rob Axtell, in a really remarkable paper [ungated copy], shows that bilateral exchange can come within \( \epsilon \) of an equilibrium set of prices in a time proportional to \( n^2 \log{1/\epsilon} \), which is much faster than any known centralized scheme. But the equilibrium reached in this way has a lot of strange, ill-controlled properties that the centralized equilibrium doesn't (it's path-dependent, for starters). In any event, this is a market economy, not a planned one.
Now, we might hope that yet faster algorithms will be found, ones which would, say, push the complexity down from cubic in \( n \) to merely linear. There are lower bounds on the complexity of optimization problems which suggest we could never hope to push it below that. No such algorithms exist, and we don't have any good reason to think that they do. We also have no reason to think that alternative computing methods would lead to such a speed-up5.
I said before that increasing the number of variables by a factor of 1000 increases the time needed by a factor of about 30 billion. To cancel this out would need a computer about 30 billion times faster, which would need about 35 doublings of computing speed, taking, if Moore's rule-of-thumb continues to hold, another half century. But my factor of 1000 for prices was quite arbitrary; if it's really more like a million, then we're talking about increasing the computation by a factor of 1021 (a more-than-astronomical, rather a chemical, increase), which is just under 70 doublings, or just over a century of Moore's Law.
If someone like Iain Banks or Ken MacLeod wants to write a novel where they say that the optimal planned economy will become technically tractable sometime around the early 22nd century, then I will read it eagerly. As a serious piece of prognostication, however, this is the kind of thinking which leads to "where's my jet-pack?" ranting on the part of geeks of a certain age.
In linear programming, all the constraints facing the planner, including those representing the available technologies of production, are linear. Economically, this means constant returns to scale: the factory need put no more, and no less, resources into its 10,000th pair of diapers as into its 20,000th, or its first.
Mathematically, the linear constraints on production are a special case of convex constraints. If a constraint is convex, then if we have two plans which satisfy it, so would any intermediate plan in between those extremes. (If plan A calls for 10,000 diapers and 2,000 towels, and plan B calls for 2,000 diapers and 10,000 towels, we could do half of plan A and half of plan B, make 6,000 diapers and 6,000 towels, and not run up against the constraints.) Not all convex constraints are linear; in convex programming, we relax linear programming to just require convex constraints. Economically, this corresponds to allowing decreasing returns to scale, where the 10,000th pair of diapers is indeed more expensive than the 9,999th, or the first.
Computationally, it turns out that the same "interior-point" algorithms which bring large linear-programming problems within reach also work on general convex programming problems. Convex programming is more computationally complex than linear programming, but not radically so.
Unfortunately for the planners, increasing returns to scale in production mean non-convex constraints; and increasing returns are very common, if only from fixed costs. If the plan calls for regular flights from Moscow to Novosibirsk, each flight has a fixed minimum cost, no matter how much or how little the plane carries. (Fuel; the labor of pilots, mechanics, and air-traffic controllers; wear and tear on the plane; wear and tear on runways; the lost opportunity of using the plane for something else.) Similarly for optimization software (you can't make any copies of the program without first expending the programmers' labor, and the computer time they need to write and debug the code). Or academic papers, or for that matter running an assembly line or a steel mill. In all of these cases, you just can't smoothly interpolate between plans which have these outputs and ones which don't. You must pay at least the fixed cost to get any output at all, which is non-convexity. And there are other sources of increasing returns, beyond fixed costs.
This is bad news for the planners, because there are no general-purpose algorithms for optimizing under non-convex constraints. Non-convex programming isn't roughly as tractable as linear programming, it's generally quite intractable. Again, the kinds of non-convexity which economic planners would confront might, conceivably, universally turn out to be especially benign, so everything becomes tractable again, but why should we think that?
If it's any consolation, allowing non-convexity messes up the markets-are-always-optimal theorems of neo-classical/bourgeois economics, too. (This illustrates Stiglitz's contention that if the neo-classicals were right about how capitalism works, Kantorovich-style socialism would have been perfectly viable.) Markets with non-convex production are apt to see things like monopolies, or at least monopolistic competition, path dependence, and, actual profits and power. (My university owes its existence to Mr. Carnegie's luck, skill, and ruthlessness in exploiting the non-convexities of making steel.) Somehow, I do not think that this will be much consolation.
So far I have been assuming, for the sake of argument, that the planners can take their objective function as given. There does need to be some such function, because otherwise it becomes hard to impossible to chose between competing plans which are all technically feasible. It's easy to say "more stuff is better than less stuff", but at some point more towels means fewer diapers, and then the planners have to decide how to trade off among different goods. If we take desired output as fixed and try to minimize inputs, the same difficulty arises (is it better to use so less cotton fiber if it requires this much more plastic?), so I will just stick with the maximization version.
For the capitalist or even market-socialist firm, there is in principle a simple objective function: profit, measured in dollars, or whatever else the local unit of account is. (I say "in principle" because a firm isn't a unified actor with coherent goals like "maximize profits"; to the extent it acts like one, that's an achievement of organizational social engineering.) The firm can say how many extra diapers it would have to sell to be worth selling one less towel, because it can look at how much money it would make. To the extent that it can take its sales prices as fixed, and can sell as much as it can make, it's even reasonable for it to treat its objective function as linear.
But what about the planners? Even if they wanted to just look at the profit (value added) of the whole economy, they get to set the prices of consumption goods, which in turn set the (shadow) prices of inputs to production. (The rule "maximize the objective function" does not help pick an objective function.) In any case, profits are money, i.e., claims, through exchange, on goods and services produced by others. It makes no sense for the goal of the economy, as a whole, to be to maximize its claims on itself.
As I mentioned, Kantorovich had a way of evading this, which was clever if not ultimately satisfactory. He imagined the goal of the planners to be to maximize the production of a "given assortment" of goods. This means that the desired ratio of goods to be produced is fixed (three diapers for every towel), and the planners just need to maximize production at this ratio. This only pushes back the problem by one step, to deciding on the "given assortment".
We are pushed back, inevitably, to the planners having to make choices which express preferences or (in a different sense of the word) values. Or, said another way, there are values or preferences — what Nove called "planners' preferences" — implicit in any choice of objective function. This raises both a cognitive or computational problem, and at least two different political problems.
The cognitive or computational problem is that of simply coming up with relative preferences or weights over all the goods in the economy, indexed by space and time. (Remember we need such indexing to handle transport and sequencing.) Any one human planner would simply have to make up most of these, or generate them according to some arbitrarily rule. To do otherwise is simply beyond the bounds of humanity. A group of planners might do better, but it would still be an immense amount of work, with knotty problems of how to divide the labor of assigning values, and a large measure of arbitrariness.
Which brings us to the first of the two political problems. The objective function in the plan is an expression of values or preferences, and people have different preferences. How are these to be reconciled?
There are many institutions which try to reconcile or adjust divergent values. This is a problem of social choice, and subject to all the usual pathologies and paradoxes of social choice. There is no universally satisfactory mechanism for making such choices. One could imagine democratic debate and voting over plans, but the sheer complexity of plans, once again, makes it very hard for members of the demos to make up their minds about competing plans, or how plans might be changed. Every citizen is put in the position of the solitary planner, except that they must listen to each other.
Citizens (or their representatives) might debate about, and vote over, highly aggregated summaries of various plans. But then the planning apparatus has to dis-aggregate, has to fill in the details left unfixed by the democratic process. (What gets voted on is a compressed encoding of the actual plan, for which the apparatus is the decoder.) I am not worried so much that citizens are not therefore debating about exactly what the plan is. Under uncertainty, especially uncertainty from complexity, no decision-maker understands the full consequences of their actions. What disturbs me about this is that filling in those details in the plan is just as much driven by values and preferences as making choices about the aggregated aspects. We have not actually given the planning apparatus a tractable technical problem (cf.).
Dictatorship might seem to resolve the difficulty, but doesn't. The dictator is, after all, just a single human being. He (and I use the pronoun deliberately) has no more ability to come up with real preferences over everything in the economy than any other person. (Thus Ashby's "law of requisite variety" strikes again.) He can, and must, delegate details to the planning apparatus, but that doesn't help the planners figure out what to do. I would even contend that he is in a worse situation than the demos when it comes to designing the planning apparatus, or figuring out what he wants to decide directly, and what he wants to delegate, but that's a separate argument. The collective dictatorship of the party, assuming anyone wanted to revive that nonsense, would only seem to give the worst of both worlds.
I do not have a knock-down proof that there is no good way of evading the problem of planners' preferences. Maybe there is some way to improve democratic procedures or bureaucratic organization to turn the trick. But any such escape is, now, entirely conjectural. In its absence, if decisions must be made, they will get made, but through the sort of internal negotiation, arbitrariness and favoritism which Spufford depicts in the Soviet planning apparatus.
This brings us to the second political problem. Even if everyone agrees on the plan, and the plan is actually perfectly implemented, there is every reason to think that people will not be happy with the outcome. They're making guesses about what they actually want and need, and they are making guesses about the implications of fulfilling those desires. We don't have to go into "Monkey's Paw" territory to realize that getting what you think you want can prove thoroughly unacceptable; it's a fact of life, which doesn't disappear in economics. And not everyone is going to agree on the plan, which will not be perfectly implemented. (Nothing is ever perfectly implemented.) These are all signs of how even the "optimal" plan can be improved, and ignoring them is idiotic.
We need then some systematic way for the citizens to provide feedback on the plan, as it is realized. There are many, many things to be said against the market system, but it is a mechanism for providing feedback from users to producers, and for propagating that feedback through the whole economy, without anyone having to explicitly track that information. This is a point which both Hayek, and Lange (before the war) got very much right. The feedback needn't be just or even mainly through prices; quantities (especially inventories) can sometimes work just as well. But what sells and what doesn't is the essential feedback.
It's worth mentioning that this is a point which Trotsky got right. (I should perhaps write that "even Trotsky sometimes got right".) To repeat a quotation:
The innumerable living participants in the economy, state and private, collective and individual, must serve notice of their needs and of their relative strength not only through the statistical determinations of plan commissions but by the direct pressure of supply and demand. The plan is checked and, to a considerable degree, realized through the market.
It is conceivable that there is some alternative feedback mechanism which is as rich, adaptive, and easy to use as the market but is not the market, not even in a disguised form. Nobody has proposed such a thing.
Both neo-classical and Austrian economists make a fetish (in several senses) of markets and market prices. That this is crazy is reflected in the fact that even under capitalism, immense areas of the economy are not coordinated through the market. There is a great passage from Herbert Simon in 1991 which is relevant here:
Suppose that ["a mythical visitor from Mars"] approaches the Earth from space, equipped with a telescope that revels social structures. The firms reveal themselves, say, as solid green areas with faint interior contours marking out divisions and departments. Market transactions show as red lines connecting firms, forming a network in the spaces between them. Within firms (and perhaps even between them) the approaching visitor also sees pale blue lines, the lines of authority connecting bosses with various levels of workers. As our visitors looked more carefully at the scene beneath, it might see one of the green masses divide, as a firm divested itself of one of its divisions. Or it might see one green object gobble up another. At this distance, the departing golden parachutes would probably not be visible.No matter whether our visitor approached the United States or the Soviet Union, urban China or the European Community, the greater part of the space below it would be within green areas, for almost all of the inhabitants would be employees, hence inside the firm boundaries. Organizations would be the dominant feature of the landscape. A message sent back home, describing the scene, would speak of "large green areas interconnected by red lines." It would not likely speak of "a network of red lines connecting green spots."6
This is not just because the market revolution has not been pushed far enough. ("One effort more, shareholders, if you would be libertarians!") The conditions under which equilibrium prices really are all a decision-maker needs to know, and really are sufficient for coordination, are so extreme as to be absurd. (Stiglitz is good on some of the failure modes.) Even if they hold, the market only lets people "serve notice of their needs and of their relative strength" up to a limit set by how much money they have. This is why careful economists talk about balancing supply and "effective" demand, demand backed by money.
This is just as much an implicit choice of values as handing the planners an objective function and letting them fire up their optimization algorithm. Those values are not pretty. They are that the whims of the rich matter more than the needs of the poor; that it is more important to keep bond traders in strippers and cocaine than feed hungry children. At the extreme, the market literally starves people to death, because feeding them is a less "efficient" use of food than helping rich people eat more.
I don't think this sort of pathology is intrinsic to market exchange; it comes from market exchange plus gross inequality. If we want markets to signal supply and demand (not just tautological "effective demand"), then we want to ensure not just that everyone has access to the market, but also that they have (roughly) comparable amounts of money to spend. There is, in other words, a strong case to be made for egalitarian distributions of resources being a complement to market allocation. Politically, however, good luck getting those to go together.
We are left in an uncomfortable position. Turning everything over to the market is not really an option. Beyond the repulsiveness of the values it embodies, markets in areas like health care or information goods are always inefficient (over and above the usual impossibility of informationally-efficient prices). Moreover, working through the market imposes its own costs (time and effort in searching out information about prices and qualities, negotiating deals, etc.), and these costs can be very large. This is one reason (among others) why Simon's Martian sees such large green regions in the capitalist countries — why actually-existing capitalism is at least as much an organizational as a market economy.
Planning is certainly possible within limited domains — at least if we can get good data to the planners — and those limits will expand as computing power grows. But planning is only possible within those domains because making money gives firms (or firm-like entities) an objective function which is both unambiguous and blinkered. Planning for the whole economy would, under the most favorable possible assumptions, be intractable for the foreseeable future, and deciding on a plan runs into difficulties we have no idea how to solve. The sort of efficient planned economy dreamed of by the characters in Red Plenty is something we have no clue of how to bring about, even if we were willing to accept dictatorship to do so.
That planning is not a viable alternative to capitalism (as opposed to a tool within it) should disturb even capitalism's most ardent partisans. It means that their system faces no competition, nor even any plausible threat of competition. Those partisans themselves should be able to say what will happen then: the masters of the system, will be tempted, and more than tempted, to claim more and more of what it produces as monopoly rents. This does not end happily.
There is a passage in Red Plenty which is central to describing both the nightmare from which we are trying to awake, and vision we are trying to awake into. Henry has quoted it already, but it bears repeating.
Marx had drawn a nightmare picture of what happened to human life under capitalism, when everything was produced only in order to be exchanged; when true qualities and uses dropped away, and the human power of making and doing itself became only an object to be traded. Then the makers and the things made turned alike into commodities, and the motion of society turned into a kind of zombie dance, a grim cavorting whirl in which objects and people blurred together till the objects were half alive and the people were half dead. Stock-market prices acted back upon the world as if they were independent powers, requiring factories to be opened or closed, real human beings to work or rest, hurry or dawdle; and they, having given the transfusion that made the stock prices come alive, felt their flesh go cold and impersonal on them, mere mechanisms for chunking out the man-hours. Living money and dying humans, metal as tender as skin and skin as hard as metal, taking hands, and dancing round, and round, and round, with no way ever of stopping; the quickened and the deadened, whirling on. ... And what would be the alternative? The consciously arranged alternative? A dance of another nature, Emil presumed. A dance to the music of use, where every step fulfilled some real need, did some tangible good, and no matter how fast the dancers spun, they moved easily, because they moved to a human measure, intelligible to all, chosen by all.
There is a fundamental level at which Marx's nightmare vision is right: capitalism, the market system, whatever you want to call it, is a product of humanity, but each and every one of us confronts it as an autonomous and deeply alien force. Its ends, to the limited and debatable extent that it can even be understood as having them, are simply inhuman. The ideology of the market tell us that we face not something inhuman but superhuman, tells us to embrace our inner zombie cyborg and lose ourselves in the dance. One doesn't know whether to laugh or cry or run screaming.
But, and this is I think something Marx did not sufficiently appreciate, human beings confront all the structures which emerge from our massed interactions in this way. A bureaucracy, or even a thoroughly democratic polity of which one is a citizen, can feel, can be, just as much of a cold monster as the market. We have no choice but to live among these alien powers which we create, and to try to direct them to human ends. It is beyond us, it is even beyond all of us, to find "a human measure, intelligible to all, chosen by all", which says how everyone should go. What we can do is try to find the specific ways in which these powers we have conjured up are hurting us, and use them to check each other, or deflect them into better paths. Sometimes this will mean more use of market mechanisms, sometimes it will mean removing some goods and services from market allocation, either through public provision7 or through other institutional arrangements8. Sometimes it will mean expanding the scope of democratic decision-making (for instance, into the insides of firms), and sometimes it will mean narrowing its scope (for instance, not allowing the demos to censor speech it finds objectionable). Sometimes it will mean leaving some tasks to experts, deferring to the internal norms of their professions, and sometimes it will mean recognizing claims of expertise to be mere assertions of authority, to be resisted or countered.
These are all going to be complex problems, full of messy compromises. Attaining even second best solutions is going to demand "bold, persistent experimentation", coupled with a frank recognition that many experiments will just fail, and that even long-settled compromises can, with the passage of time, become confining obstacles. We will not be able to turn everything over to the wise academicians, or even to their computers, but we may, if we are lucky and smart, be able, bit by bit, make a world fit for human beings to live in.
[1] Vaguely lefty? Check. Science fiction reader? Check. Interested in economics? Check. In fact: family tradition of socialism extending to having a relative whose middle name was "Karl Marx"? Check. Gushing Ken MacLeod fan? Check. Learned linear programming at my father's knee as a boy? Check. ^
[2] More exactly, many optimization problems have the property that we can check a proposed solution in polynomial time (these are the class "NP"), but no one has a polynomial-time way to work out a solution from the problem statement (which would put them in the class "P"). If a problem is in NP but not in P, we cannot do drastically better than just systematically go through candidate solutions and check them all. (We can often do a bit better, especially on particular cases, but not drastically better.) Whether there are any such problems, that is whether NP \( \neq \) P, is not known, but it sure seems like it. So while most common optimization problems are in NP, linear and even convex programming are in P. ^
[3]: Most of the relevant work has been done under a slightly different cover --- not determining shadow prices in an optimal plan, but equilibrium prices in Arrow-Debreu model economies. But this is fully applicable to determining shadow prices in the planning system. (Bowles and Gintis: "The basic problem with the Walrasian model in this respect is that it is essentially about allocations and only tangentially about markets — as one of us (Bowles) learned when he noticed that the graduate microeconomics course that he taught at Harvard was easily repackaged as 'The Theory of Economic Planning' at the University of Havana in 1969.") Useful references here are Deng, Papadimitriou and Safra's "On the Complexity of Price Equilibria" [STOC '02. preprint], Condenotti and Varadarajan's "Efficient Computation of Equilibrium Prices for Markets with Leontief Utilities", and Ye's "A path to the Arrow-Debreu competitive market equilibrium". ^
[4]: In the mathematical appendix to Best Use, Kantorovich goes to some length to argue that his objectively determined values are compatible with the labor theory of value, by showing that the o.d. values are proportional to the required labor in the optimal plan. (He begins by assuming away the famous problem of equating different kinds of labor.) A natural question is how seriously this was meant. I have no positive evidence that it wasn't sincere. But, carefully examined, all that he proves is proportionality between o.d. values and the required consumption of the first component of the vector of inputs — and the ordering of inputs is arbitrary. Thus the first component could be any input to the production process, and the same argument would go through, leading to many parallel "theories of value". (There is a certain pre-Socratic charm to imagining proponents of the labor theory of value arguing it out with the water-theorists or electricity-theorists.) It is hard for me to believe that a mathematician of Kantorovich's skill did not see this, suggesting that the discussion was mere ideological cover. It would be interesting to know at what stage in the book's "adventures" this part of the appendix was written. ^
[5]: In particular, there's no reason to think that building a quantum computer would help. This is because, as some people have to keep pointing out, quantum computers don't provide a general exponential speed-up over classical ones. ^
[6]: I strongly recommend reading the whole of this paper, if these matters are at all interesting. One of the most curious features of this little parable was that Simon was red-green color-blind. ^
[7]: Let me be clear about the limits of this. Already, in developed capitalism, such public or near-public goods as the protection of the police and access to elementary schooling are provided universally and at no charge to the user. (Or they are supposed to be, anyway.) Access to these is not regulated by the market. But the inputs needed to provide them are all bought on the market, the labor of teachers and cops very much included. I cannot improve on this point on the discussion in Lindblom's The Market System, so I will just direct you to that (i, ii). ^
[8]: To give a concrete example, neither scientific research nor free software are produced for sale on the market. (This disappoints some aficionados of both.) Again, the inputs are obtained from markets, including labor markets, but the outputs are not sold on them. How far this is a generally-viable strategy for producing informational goods is a very interesting question, which it is quite beyond me to answer. ^
Manual trackback: Brad DeLong; Attempts; MetaFilter; and again Brad DeLong; 3 Quarks Daily; Wolfgang Beirl; A (Budding) Sociologist's Commonplace Book; Random Walks; Infocult; An Unenviable Situation [While it's not for me to argue whether "Shalizi is an idiot", the fact that Edenbaum thinks I would disagree with him when he says "We don't need better, smarter, masters of the universe, we need a more educated populace and scholars with a sense of irony. We need fewer philosophers and more historians. We need a return to the understanding that greed is inevitable, but that's its a weakness, and that democracies have freedom of speech not because governments grant it but because the government is not granted the power to take it away. Technocrats as fantasists of their own power have everything backwards." suggests a really massive failure on my part to be clear. (Well, actually I have no opinion as to whether we need "fewer philosophers and more historians".)]; Blog Pra falar de coisas; The Early Days of a Better Nation (I am not worthy!); Compromise and Conceit; Louis Proyect; Rules of Reason; Crooked Timber; Fernando Pereira
Update, 5 June 2012: Added some links which should've been there originally, fixed a typo which made it seem like I think P=NP.
Update, 5 July: Spufford's response. Also, a prize.
The Dismal Science; The Progressive Forces; Scientifiction and Fantastica; Automata and Calculating Machines
Posted by crshalizi at May 30, 2012 09:19 | permanent link
Attention conservation notice: 8000+ words of political theory by geeks.
For quite a while now, Henry Farrell and I have been worrying at a skein of ideas running between institutions, networks, evolutionary games, democracy, collective cognition, the Internet and inequality. Turning these threads into a single seamless garment is beyond our hopes (and not our style anyway), but we think we've been getting somewhere in at least usefully disentangling them. An upcoming workshop gave us an excuse to set out part (but not all) of the pattern, and so here's a draft. To the extent you like it, thank Henry; the remaining snarls are my fault.
This is a draft, and anyway it's part of the spirit of the piece that feedback would be appropriate. I do not have comments, for my usual reasons, but it's cross-posted at Crooked Timber and The Monkey Cage, and you can always send an e-mail.
(Very Constant Readers will now see the context for a lot of my non-statistical writing over the last few years, including the previous post.)
In this essay, we outline a cognitive approach to democracy. Specifically, we argue that democracy has unique benefits as a form of collective problem solving in that it potentially allows people with highly diverse perspectives to come together in order collectively to solve problems. Democracy can do this better than either markets and hierarchies, because it brings these diverse perceptions into direct contact with each other, allowing forms of learning that are unlikely either through the price mechanism of markets or the hierarchical arrangements of bureaucracy. Furthermore, democracy can, by experimenting, take advantage of novel forms of collective cognition that are facilitated by new media.
Much of what we say is synthetic --- our normative arguments build on both the academic literature (Joshua Cohen's and Josiah Ober's arguments about epistemic democracy; Jack Knight and James Johnson's pragmatist account of the benefits of a radically egalitarian democracy and Elster and Landemore's forthcoming collection on Collective Wisdom), and on arguments by public intellectuals such as Steven Berlin Johnson, Clay Shirky, Tom Slee and Chris Hayes. We also seek to contribute to new debates on the sources of collective wisdom. Throughout, we emphasize the cognitive benefits of democracy, building on important results from cognitive science, from sociology, from machine learning and from network theory.
We start by explaining social institutions should do. Next, we examine sophisticated arguments that have been made in defense of markets (Hayek's theories about catallaxy) and hierarchy (Richard Thaler and Cass Sunstein's "libertarian paternalism") and discuss their inadequacies. The subsequent section lays out our arguments in favor of democracy, illustrating how democratic procedures have cognitive benefits that other social forms do not. The penultimate section discusses how democracy can learn from new forms of collective consensus formation on the Internet, treating these forms not as ideals to be approximated, but as imperfect experiments, whose successes and failures can teach us about the conditions for better decision making; this is part of a broader agenda for cross-disciplinary research involving computer scientists and democratic theorists.
What are broad macro-institutions such as politics, markets and hierarchies good for? Different theorists have given very different answers to this question. The dominant tradition in political theory tends to evaluate them in terms of justice --- whether institutions use procedures, or give results, that can be seen as just according to some reasonable normative criterion. Others, perhaps more cynically, have focused on their potential contribution to stability --- whether they produce an acceptable level of social order, which minimizes violence and provides some modicum of predictability. In this essay, we analyze these institutions according to a different criterion. We start with a pragmatist question - whether these institutions are useful in helping us to solve difficult social problems.1
Some of the problems that we face in politics are simple ones (not in the sense that solutions are easy, but in the sense that they are simple to analyze). However, the most vexing problems are usually ones without any very obvious solutions. How do we change legal rules and social norms in order to mitigate the problems of global warming? How do we regulate financial markets so as to minimize the risk of new crises emerging, and limit the harm of those that happen? How do we best encourage the spread of human rights internationally?
These problems are pressing --- yet they are difficult to think about systematically, let alone solve. They all share two important features. First, they are all social problems. That is, they are problems which involve the interaction of large numbers of human beings, with different interests, desires, needs and perspectives. Second, as a result, they are complex problems, in the sense that scholars of complexity understand the term. To borrow Scott Page's (2011, p. 25) definition, they involve "diverse entities that interact in a network or contact structure."2 They are a result of behavior that is difficult to predict, so that consequences to changing behavior are extremely hard to map out in advance. Finding solutions is difficult, and even when we find one, it is hard to know whether it is good in comparison to other possible solutions, let alone the best.
We argue that macro-institutions will best be able to tackle these problems if they have two features. First, they should foster a high degree of direct communication between individuals with diverse viewpoints. This kind of intellectual diversity is crucial to identifying good solutions to complex problems. Second, we argue that they should provide relative equality among affected actors in decision-making processes, so as to prevent socially or politically powerful groups from blocking socially beneficial changes to the detriment of their own particular interests.
We base these contentions on two sets of arguments, one from work on collective problem solving, the other from theories of political power. Both are clarified if we think of the possible solutions to a difficult problem as points on a landscape, where we seek the highest point. Difficult problems present many peaks, solutions that are better than the points close to them. Such landscapes are rugged --- they have some degree of organization, but are not so structured that simple algorithms can quickly find the best solution. There is no guarantee that any particular peak is globally optimal (i.e. the best solution across the entire landscape) rather than locally optimal (the best solution within a smaller subset of the landscape).
Solving a complex problem involves a search across this landscape for the best visible solutions. Individual agents have limited cognitive abilities, and (usually) limited knowledge of the landscape. Both of these make them likely to get stuck at local optima, which may be much worse than even other local peaks, let alone the global optimum. Less abstractly, people may settle for bad solutions, because they do not know better (they cannot perceive other, better solutions), or because they have difficulty in reaching these solutions (e.g. because of coordination problems, or because of the ability of powerful actors to veto possible changes).
Lu Hong and Scott Page (2004) use mathematical models to argue that diversity of viewpoints helps groups find better solutions (higher peaks on the landscape). The intuition is that different individuals, when confronting a problem, "see" different landscapes --- they organize the set of possible solutions in different ways, some of which are useful in identifying good peaks, some of which less so. Very smart individuals (those with many mental tools) have better organized landscapes than less smart individuals, and so are less likely to get trapped at inferior local optima. However, at the group level, diversity of viewpoints matters a lot. Page and Hong find that "diversity trumps ability". Groups with high diversity of internal viewpoints are better able to identify optima than groups composed of much smarter individuals with more homogenous viewpoints. By putting their diverse views together, the former are able to map out more of the landscape and identify possible solutions that would be invisible to groups of individuals with more similar perspectives.
Page and Hong do not model the social processes through which individuals can bring their diverse points of view together into a common framework. However, their arguments surely suggest that actors' different points of view need to be exposed directly to each other, in order to identify the benefits and drawbacks of different points of view, the ways in which viewpoints can be combined to better advantage, and so on. These arguments are supported by a plethora of work in sociology and elsewhere (Burt, Rossman etc). As we explain at length below, some degree of clumping is also beneficial, so so that individuals with divergent viewpoints do not converge too quickly.
The second issue for collective problem solving is more obvious. Even when groups are able to identify good solutions (relatively high peaks in the solution landscape), they may not be able to reach them. In particular, actors who benefit from the status quo (or who would prefer less generally-beneficial solutions) may be able to use political and social power to block movement towards such peaks, and instead compel movement towards solutions that have lower social and greater individual benefits. Research on problem solving typically does not talk about differences in actors' interests, or in actors' ability successfully to pursue their interests. While different individuals initially perceive different aspects of the landscape, researchers assume that once they are able to communicate with each other, they will all agree on how to rank visible solutions from best to worst. But actors may have diverse interests as well as diverse understandings of the world (and the two may indeed be systematically linked). They may even be working in such different landscapes, in terms of personal advantage, that one actor's peak is another's valley, and vice versa. Moreover, actors may differ in their ability to ensure that their interests are prosecuted. Recent work in political theory (Knight 1992, Johnson and Knight 2011), economics (Bowles and Naidu, 2008), political science (Hacker and Pierson 2010) and sociology details how powerful actors may be able to compel weaker ones to accept solutions that are to the advantage of the former, but that have lower overall social benefits.
Here, relative equality of power can have important consequences. Individuals in settings with relatively equal power relations, are, ceteris paribus more likely to converge on solutions with broad social benefits, and less likely to converge on solutions that benefit smaller groups of individuals at the expense of the majority. Furthermore, equal power relations may not only make it easier to converge on "good" solutions when they have been identified, but may stimulate the process of search for such solutions. Participating in the search for solutions and in decision-making demands resources (at a minimum, time), and if those resources are concentrated in a small set of actors, with similar interests and perspectives, the solutions they will find will be fewer and worse than if a wide variety of actors can also search.
With this in mind, we ask whether different macro-institutions are better, or worse at solving the complex problems that confront modern economies and societies. Institutions will tend to do better to the extent that they both (i) bring together people with different perspectives, and (ii) share decision-making power relatively equally. Our arguments are, obviously, quite broad. We do not speak much to the specifics of how macro-institutions work, instead focusing on the broad logics of these different macro-institutions. Furthermore, we do not look at the ways in which our desiderata interact with other reasonable desiderata (such as social stability, justice and so on). Even so, we think that it is worth clarifying the ways in which different institutions can, or cannot, solve complex problems. In recent decades, for example, many scholars and policy makers have devoted time and energy to advocating markets as the way to address social problems that are too complex to be solved by top-down authority. As we show below, markets, to the extent that they imply substantial power inequalities, and increasingly homogenize human relations, are unlikely to possess the virtues attributed to them, though they can have more particular benefits under specific circumstances. Similarly, hierarchy suffers from dramatic informational flaws. This prompts us to reconsider democracy, not for the sake of justice or stability, but as a tool for solving the complex problems faced by modern societies.
Many scholars and public intellectuals believe that markets or hierarchies provide better ways to solve complex problems than democracy. Advocates of markets usually build on the groundbreaking work of F. A. von Hayek, to argue that market based forms of organization do a better job of eliciting information and putting it to good work than does collective organization. Advocates of hierarchy do not write from any such unified tradition. However, Richard Thaler and Cass Sunstein have recently made a sophisticated case for the benefits of hierarchy. They advocate a combination of top-down mechanism design and institutions designed to guide choices rather than to constrain them - what they call libertarian paternalism - as a way to solve difficult social problems. Hayek's arguments are not the only case for markets, and Thaler and Sunstein's are not the only justification for hierarchy. They are, however, among the best such arguments, and hence provide a good initial way to test the respective benefits of markets, hierarchies and democracies in solving complex problems. If there are better arguments, which do not fall victim to the kinds of problems we point to, we are not aware of them (but would be very happy to be told of them).
Hayek's account of the informational benefits of markets is groundbreaking. Although it builds on the insights of others (particularly Michael Polanyi), it is arguably the first real effort to analyze how social institutions work as information-processors. Hayek reasons as follows. Much of human knowledge (as Polanyi argues) is practical, and cannot be fully articulated ("tacit"). This knowledge is nonetheless crucial to economic life. Hence, if we are to allocate resources well, we must somehow gather this dispersed, fragmentary, informal knowledge, and make it useful.
Hayek is explicit that no one person can know all that is required to allocate resources properly, so there must be a social mechanism for such information processing. Hayek identifies three possible mechanisms: central planning, planning by monopolistic industries, and decentralized planning by individuals. He argues that the first and second of these break down when we take account of the vast amount of tacit knowledge, which cannot be conveyed to any centralized authority. Centralized or semi-centralized planning are especially poor at dealing with the constant flows of major and minor changes through which an economy (or, as Hayek would prefer, a catallaxy) approaches balance. To deal with such changes, we need people to make the necessary decisions on the spot --- but we also need some way to convey the appropriate information about changes in the larger economic system to him or her. The virtue of the price system, for Hayek, is to compress diffuse, even tacit, knowledge about specific changes in specific circumstances into a single index, which can guide individuals as to how they ought respond to changes elsewhere. I do not need to grasp the intimate local knowledge of the farmer who sells me tomatoes in order to decide whether to buy their products. The farmer needs to know the price of fertilizer, not how it is made, or what it could be used for other than tomatoes, or the other uses of the fertilizers' ingredients. (I do not even need to know the price of fertilizer.) The information that we need, to decide whether to buy tomatoes or to buy fertilizer, is conveyed through prices, which may go up or down, depending on the aggregate action of many buyers or suppliers, each working with her own tacit understandings.
This insight is both crucial and beautiful3, yet it has stark limits. It suggests that markets will be best at conveying a particular kind of information about a particular kind of underlying facts, i.e., the relative scarcity of different goods. As Stiglitz (2000) argues, market signals about relative scarcity are always distorted, because prices embed information about many other economically important factors. More importantly, although information about relative scarcity surely helps markets approach some kind of balance, it is little help in solving more complicated social problems, which may depend not on allocating existing stocks of goods in a useful way, given people's dispersed local knowledge, so much as discovering new goods or new forms of allocation. More generally, Hayek's well-known detestation for projects with collective goals lead him systematically to discount the ways in which aggregate knowledge might work to solve collective rather than individual problems.
This is unfortunate. To the extent that markets fulfil Hayek's criteria, and mediate all relevant interactions through the price mechanism, they foreclose other forms of exchange that are more intellectually fruitful. In particular, Hayek's reliance on arguments about inarticulable tacit knowledge mean that he leaves no place for reasoned discourse or the useful exchange of views. In Hayek's markets, people communicate only through prices. The advantage of prices, for Hayek, is that they inform individuals about what others want (or don't want), without requiring anyone to know anything about anyone else's plans or understandings. But there are many useful forms of knowledge that cannot readily be conveyed in this way.
Individuals may learn something about those understandings as a by-product of market interactions. In John Stuart Mill's description:
But the economical advantages of commerce are surpassed in importance by those of its effects which are intellectual and moral. It is hardly possible to overrate the value, in the present low state of human improvement, of placing human beings in contact with persons dissimilar to themselves, and with modes of thought and action unlike those with which they are familiar. Commerce is now what war once was, the principal source of this contact.
However, such contact is largely incidental --- people engage in market activities to buy or to sell to best advantage, not to learn. As markets become purer, in both the Hayekian and neo-classical senses, they produce ever less of the contact between different modes of life that Mill regards as salutary. The resurgence of globalization; the creation of an Internet where people who will only ever know each other by their account names buy and sell from each other; the replacement of local understandings with global standards; all these provide enormous efficiency gains and allow information about supply and demand to flow more smoothly. Yet each of them undermines the Millian benefits of commerce, by making it less likely that individuals with different points of view will have those perspectives directly exposed to each other. More tentatively, markets may themselves have a homogenizing impact on differences between individuals and across societies, again reducing diversity. As Albert Hirschman shows, there is a rich, if not unambiguous, literature on the global consequences of market society. Sociologists such as John Meyer and his colleagues find evidence of increased cultural and social convergence across different national contexts, as a result of exposure to common market and political forces.
In addition, it is unclear whether markets in general reduce power inequalities or reinforce them in modern democracies. It is almost certainly true that the spread of markets helped undermine some historical forms of hierarchy, such as feudalism (Marx). It is not clear that they continue to do so in modern democracies. On the one hand, free market participation provides individuals with some ability (presuming equal market access, etc.) to break away from abusive relationships. On the other, markets provide greater voice and choice to those with more money; if money talks in politics, it shouts across the agora. Nor are these effects limited to the marketplace. The market facilitates and fosters asymmetries of wealth which in turn may be directly or indirectly translated into asymmetries of political influence (Lindblom). Untrammeled markets are associated with gross income inequalities, which in turn infects politics with a variety of pathologies. This suggests that markets fail in the broader task of exposing individuals' differing perspectives to each to each other. Furthermore, markets are at best indifferent levelers of unequal power relations.
Does hierarchy do better? In an influential recent book, Richard Thaler and Cass Sunstein suggest that it does. They argue that "choice architects", people who have "responsibility for organizing the context in which people make decisions," can design institutions so as to spur people to take better choices rather than worse ones. Thaler and Sunstein are self-consciously paternalist, claiming that flawed behavior and thinking consistently stop people from making the choices that are in their best interests. However, they also find direct control of people's choices morally opprobrious. Libertarian paternalism seeks to guide but not eliminate choice, so that the easiest option is the "best" choice that individuals would make, if they only had sufficient attention and discipline. It provides paternalistic guidance through libertarian means, shaping choice contexts to make it more likely that individuals will make the right choices rather than the wrong ones.
This is, in Thaler and Sunstein's words, a politics of "nudging" choices rather than dictating them. Although Thaler and Sunstein do not put it this way, it is also a plea for the benefits of hierarchy in organizations and, in particular, in government. Thaler and Sunstein's "choice architects" are hierarchical superiors, specifically empowered to create broad schemes that will shape the choices of many other individuals. Their power to do this does not flow from, e.g., accountability to those whose choices get shaped. Instead, it flows from positions of authority within firm or government, which allow them to craft pension contribution schemes within firms, environmental policy within the government, and so on.
Thaler and Sunstein's recommendations have outraged libertarians, who believe that a nudge is merely a well-aimed shove --- that individuals' freedom will be reduced nearly as much by Thaler and Sunstein's choice architecture, as it would be by direct coercion. We are also unenthusiastic about libertarian paternalism, but for different reasons. While we do not talk, here, about coercion, we have no particular normative objection to it, provided that it is proportionate, directed towards legitimate ends, and constrained by well-functioning democratic controls. Instead, we worry that the kinds of hierarchy that Thaler and Sunstein presume actively inhibit the unconstrained exchange of views that we see as essential to solving complex problems.
Bureaucratic hierarchy is an extraordinary political achievement. States with clear, accountable hierarchies can achieve vast and intricate projects, and businesses use hierarchies to coordinate highly complex chains of production and distribution.4 Even so, there are reasons why bureaucracies have few modern defenders. Hierarchies rely on power asymmetries to work. Inferiors take orders from superiors, in a chain of command leading up to the chief executive officer (in firms) or some appointed or non-appointed political actor (in government). This is good for pushing orders down the chain, but notoriously poor at transmitting useful information up, especially kinds of information superiors did not anticipate wanting. As scholars from Max Weber on have emphasized, bureaucracies systematically encourage a culture of conformity in order to increase predictability and static efficiency.
Thaler and Sunstein presume a hierarchy in which orders are followed and policies are implemented, but ignore what this implies about feedback. They imagine hierarchically-empowered architects shaping the choices of a less well-informed and less rational general population. They discuss ordinary people's bad choices at length. However, they have remarkably little to say about how it is that the architects housed atop the hierarchy can figure out better choices on these individuals' behalf, or how the architectures can actually design choice systems that will encourage these choices. Sometimes, Thaler and Sunstein suggest that choice architects can rely on introspection: "Libertarian paternalists would like to set the default by asking what reflective employees in Janet's position would actually want." At other times, they imply that choice architects can use experimental techniques. The book's opening analogy proposes a set of experiments, in which the director of food services for a system "with hundreds of schools" (p. 1), "who likes to think about things in non-traditional ways," experiments with different arrangements of food in order to discover which displays encourage kids to pick the healthier options. Finally, Thaler and Sunstein sometimes argue that choice architects can use results from the social sciences to find optima.
One mechanism of information gathering that they systematically ignore is active feedback from citizens. Although they argue in passing that feedback from choice architects can help guide consumers, e.g., giving information about the content of food, or by shaping online interactions to ensure that people are exposed to others' points of view, they have no place for feedback from the individuals whose choices are being manipulated to help guide the choice architects, let alone to constrain them. As Suzanne Mettler (2011) has pointed out, Thaler and Sunstein depict citizens as passive consumers, who need to be guided to the desired outcomes, rather than active participants in democratic decision making.
This also means that Thaler and Sunstein's proposals don't take advantage of diversity. Choice architects, located within hierarchies which tend generically to promote conformity, are likely to have a much more limited range of ways of understanding problems than the population whose choices they are seeking to structure. In Scott Page's terms, these actors are may very "able" --- they will have sophisticated and complex heuristics, so that each individual choice architect is better able than each individual member of the population to see a large portion of the landscape of possible choices and outcomes. However, the architects will be very similar to each other in background and training, so that as a group they will see a far more limited set of possibilities than a group of randomly selected members of the population (who are likely to have less sophisticated but far more diverse heuristics). Cultural homogeneity among hierarchical elites helps create policy disasters (the "best and brightest" problem). Direct involvement of a wider selection of actors with more diverse heuristics would alleviate this problem.
However, precisely because choice architects rely on hierarchical power to create their architectures, they will have difficulty in eliciting feedback, even if they want to. Inequalities of power notoriously dampen real exchanges of viewpoints. Hierarchical inferiors within organizations worry about contradicting their bosses. Ordinary members of the public are uncomfortable when asked to contradict experts or officials. Work on group decision making (including, e.g., Sunstein 2003) is full of examples of how perceived power inequalities lead less powerful actors either to remain silent, or merely to affirm the views of more powerful actors, even when they have independently valuable perspectives or knowledge.
In short, libertarian paternalism is flawed, not because it restricts peoples' choices, but because it makes heroic assumptions about choice architects' ability to figure out what the actual default choices should be, and blocks their channels for learning better. Choice architects will be likely to share a narrow range of sophisticated heuristics, and to have difficulty in soliciting feedback from others with more diverse heuristics, because of their hierarchical superiority and the unequal power relations that this entails. Libertarian paternalism may still have value in situations of individual choice, where people likely do "want" e.g. to save more or take more exercise, but face commitment problems, or when other actors have an incentive to misinform these people or to structure their choices in perverse ways in the absence of a 'good' default choice. However, it will be far less useful, or even actively pernicious, in complex situations, where many actors with different interests make interdependent choices. Indeed, Thaler and Sunstein are far more convincing when they discuss how to encourage people to choose appropriate pension schemes than when they suggest that environmental problems are the "outcome of a global choice architecture system" that could be usefully rejiggered via a variety of voluntaristic mechanisms.
Is democracy better at identifying solutions to complex problems? Many --- even on the left --- doubt that it is. They point to problems of finding common ground and of partisanship, and despair of finding answers to hard questions. The dominant tradition of American liberalism actually has considerable distaste for the less genteel aspects of democracy. The early 20th century Progressives and their modern heirs deplore partisanship and political rivalry, instead preferring technocracy, moderation and deliberation (Rosenblum 2008). Some liberals (e.g., Thaler and Sunstein) are attracted to Hayekian arguments for markets and libertarian paternalist arguments for hierarchy exactly because they seem better than the partisan rancor of democratic competition.
We believe that they are wrong, and democracy offers a better way of solving complex problems. Since, as we've argued, power asymmetries inhibit problem-solving, democracy has a large advantage over both markets and technocratic hierarchy. The fundamental democratic commitment is to equality of power over political decision making. Real democracies do not deliver on this commitment any more than real markets deliver perfect competition, or real hierarchies deliver an abstractly benevolent interpretation of rules. But a commitment to democratic improvements is a commitment to making power relations more equal, just as a commitment to markets is to improving competition, and a commitment to hierarchy (in its positive aspects) is a commitment to greater disinterestedness. This implies that a genuine commitment to democracy is a commitment to political radicalism. We embrace this.
Democracy, then, is committed to equality of power; it is also well-suited to exposing points of view to each other in a way that leads to identifying better solutions. This is because democracy also involves debate. In competitive elections and in more intimate discussions, democratic actors argue over which proposals are better or worse, exposing their different perspectives to each other.
Yet at first glance, this interchange of perspectives looks ugly: it is partisan, rancorous and vexatious, and people seem to never change their minds. This leads some on the left to argue that we need to replace traditional democratic forms with ones that involve genuine deliberation, where people will strive to be open-minded, and to transcend their interests. These aspirations are hopelessly utopian. Such impartiality can only be achieved fleetingly at best, and clashes of interest and perception are intrinsic to democratic politics.
Here, we concur with Jack Knight and Jim Johnson's important recent book (2011), which argues that politics is a response to the problem of diversity. Actors with differing --- indeed conflicting --- interests and perceptions find that their fates are bound together, and that they must make the best of this. Yet, Knight and Johnson argue, politics is also a matter of seeking to harness diversity so as to generate useful knowledge. They specifically do not argue that democracy requires impartial deliberation. Instead, they claim that partial and self-interested debate can have epistemological benefits. As they describe it, "democratic decision processes make better use of the distributed knowledge that exists in a society than do their rivals" such as market coordination or judicial decision making (p. 151). Knight and Johnson suggest that approaches based on diversity, such as those of Scott Page and Elizabeth Anderson, provide a better foundation for thinking about the epistemic benefits of democracy than the arguments of Condorcet and his intellectual heirs.
We agree. Unlike Hayek's account of markets, and Thaler and Sunstein's account of hierarchy, this argument suggests that democracy can both foster communication among individuals with highly diverse viewpoints. This is an argument for cognitive democracy, for democratic arrangements that take best advantage of the cognitive diversity of their population. Like us, Knight and Johnson stress the pragmatic benefits of equality. Harnessing the benefits of diversity means ensuring that actors with a very wide range of viewpoints have the opportunity to express their views and to influence collective choice. Unequal societies will select only over a much smaller range of viewpoints --- those of powerful people. Yet Knight and Johnson do not really talk about the mechanisms through which clashes between different actors with different viewpoints result in better decision making. Without such a theory, it could be that conflict between perspectives results in worse rather than better problem solving. To make a good case for democracy, we not only need to bring diverse points of view to the table, but show that the specific ways in which they are exposed to each other have beneficial consequences for problem solving.
There is micro-level work which speaks to this issue. Hugo Mercier and Dan Sperber (2011) advance a purely 'argumentative' account of reasoning, on which reasoning is not intended to reach right answers, but rather to evaluate the weaknesses of others' arguments and come up with good arguments to support one's own position. This explains both why confirmation bias and motivated reasoning are rife, and why the quality of argument is significantly better when actors engage in real debates. Experimentally, individual performance when reasoning in non-argumentative settings is 'abysmal,' but is 'good' in argumentative settings. This, in turn, means that groups are typically better in solving problems than is the best individual within the group . Indeed, where there is diversity of opinion, confirmation bias can have positive consequences in pushing people to evaluate and improve their arguments in a competitive setting.
When one is alone or with people who hold similar views, one's arguments will not be critically evaluated. This is when the confirmation bias is most likely to lead to poor outcomes. However, when reasoning is used in a more felicitous context — that is, in arguments among people who disagree but have a common interest in the truth — the confirmation bias contributes to an efficient form of division of cognitive labor. When a group has to solve a problem, it is much more efficient if each individual looks mostly for arguments supporting a given solution. They can then present these arguments to the group, to be tested by the other members. This method will work as long as people can be swayed by good arguments, and the results reviewed ... show that this is generally the case. This joint dialogic approach is much more efficient than one where each individual on his or her own has to examine all possible solutions carefully (p. 65).
A separate line of research in experimental social psychology (Nemeth et al. (2004), Nemeth and Ormiston (2007), and Nemeth (2012)) indicates that problem-solving groups produce more solutions, which outsiders assess as better and more innovative, when they contain persistent dissenting minorities, and are encouraged to engage in, rather than refrain from, mutual criticism. (Such effects can even be seen in school-children: see Mercer, 2000.) This, of course, makes a great deal of sense from Mercier and Sperber's perspective.
This provides micro-level evidence that political argument will improve problem solving, even if we are skeptical about human beings' ability to abstract away from their specific circumstances and interests. Neither a commitment to deliberation, nor even standard rationality is required for argument to help solve problems. This has clear implications for democracy, which forces actors with very different perspectives to engage with each others' viewpoints. Even the most homogenous-seeming societies contain great diversity of opinion and of interest (the two are typically related) within them. In a democracy, no single set of interests or perspectives is likely to prevail on its own. Sometimes, political actors have to build coalitions with others holding dissimilar views, a process which requires engagement between these views. Sometimes, they have to publicly contend with others holding opposed perspectives in order to persuade uncommitted others to favor their interpretation, rather than another. Sometimes, as new issues arise, they have to persuade even their old allies of how their shared perspectives should be reinterpreted anew.
More generally, many of the features of democracy that skeptical liberals deplore are actually of considerable benefit. Mercier and Sperber's work provides microfoundations for arguments about the benefits of political contention, such as John Stuart Mill's, and of arguments for the benefits of partisanship, such as Nancy Rosenblum's (2008) sympathetic critique and reconstruction of Mill. Their findings suggest that the confirmation bias that political advocates have are subject to can have crucial benefits, so long as it is tempered by the ability to evaluate good arguments in context.
Other work suggests that the macro-structures of democracies too can have benefits. Lazer and Friedman (2007) find on the basis of simulations that problem solvers connected via linear networks (in which there are few links) will find better solutions over the long run than problem solvers connected via totally connected networks (in which there all nodes are linked to each other). In a totally connected network, actors copy the best immediately visible solution quickly, driving out diversity from the system, while in a linear network, different groups explore the space around different solutions for a much longer period, making it more likely that they will identify better solutions that were not immediately apparent. Here, the macro-level structure of the network does the same kind of work that confirmation bias does in Mercier and Sperber's work --- it preserves diversity and encourages actors to keep exploring solutions that may not have immediate payoffs.5
This work offers a cognitive justification for the macro-level organization of democratic life around political parties. Party politics tends to organize debate into intense clusters of argument among people (partisans for the one or the other party) who agree in broad outline about how to solve problems, but who disagree vigorously about the specifics. Links between these clusters are much rarer than links within them, and are usually mediated by competition. Under a cognitive account, one might see each of these different clusters as engaged in exploring the space of possibilities around a particular solution, maintaining some limited awareness of other searches being performed within other clusters, and sometimes discreetly borrowing from them in order to improve competitiveness, but nonetheless preserving an essential level of diversity (cf. Huckfeldt et al., 2004). Such very general considerations do not justify any specific partisan arrangement, as there may be better (or worse) arrangements available. What it does is highlight how party organization and party competition can have benefits that are hard or impossible to match in a less clustered and more homogenous social setting. Specifically, it shows how partisan arrangements can be better at solving complex problems than non-partisan institutions, because they better preserve and better harness diversity.
This leads us to argue that democracy will be better able to solve complex problems than either markets or hierarchy, for two reasons. First, democracy embodies a commitment to political equality that the other two macro-institutions do not. Clearly, actual democracies achieve political equality more or less imperfectly. Yet if we are right, the better a democracy is at achieving political equality, the better it will be, ceteris paribus, at solving complex problems. Second, democratic argument, which people use either to ally with or to attack those with other points of view, is better suited to exposing different perspectives to each other, and hence capturing the benefits of diversity, than either markets or hierarchies. Notably, we do not make heroic claims about people's ability to deliberate in some context that is free from faction and self-interest. Instead, even under realistic accounts of how people argue, democratic argument will have cognitive benefits, and indeed can transform private vices (confirmation bias) into public virtues (the preservation of cognitive diversity)6. Democratic structures --- such as political parties --- that are often deplored turn out to have important cognitive advantages.
As we have emphasized several times, we have no reason to think that actually-existing democratic structures are as good as they could be, or even close. If nothing else, designing institutions is, itself, a highly complex problem, where even the most able decision-makers have little ability to foresee the consequences of their actions. Even when an institution works well at one time, the array of other institutions, social and physical conditions in which it must function is constantly changing. Institutional design and reform, then, is unavoidably a matter of more or less ambitious "piecemeal social experiments", to use the phrase of Popper (1957). As emphasized by Popper, and by independently by Knight and Johnson, one of the strengths of democracy is its ability to make, monitor, and learn from such experiments.7 (Knight and Johnson particularly emphasize the difficulty markets have in this task.) Democracies can, in fact, experiment with their own arrangements.
For several reasons, the rise of the Internet makes this an especially propitious time for experimenting with democratic structures themselves. The means available for communication and information-processing are obviously going to change the possibilities for collective decision-making. (Bureaucracy was not an option in the Old Stone Age, nor representative democracy without something like cheap printing.) We do not yet know the possibilities of Internet-mediated communication for gathering dispersed knowledge, for generating new knowledge, for complex problem-solving, or for collective decision-making, but we really ought to find out.
In fact, we are already starting to find out. People are building systems to accomplish all of these tasks, in narrower or broader domains, for their own reasons. Wikipedia is, of course, a famous example of allowing lots of more-or-less anonymous people to concentrate dispersed information about an immense range of subjects, and to do so both cheaply and reliably8. Crucially, however, it is not unique. News-sharing sites like Digg, Reddit, etc. are ways of focusing collective attention and filtering vast quantities of information. Sites like StackExchange have become a vital part of programming practice, because they encourage the sharing of know-how about programming, with the same system spreading to many other technical domains. The knowledge being aggregated through such systems is not tacit, rather it is articulated and discursive, but it was dispersed and is now shared. Similar systems are even being used to develop new knowledge. One mode of this is open-source software development, but it is also being used in experiments like the Polymath Project for doing original mathematics collaboratively9.
At a more humble level, there are the ubiquitous phenomena of mailing lists, discussion forums, etc., etc., where people with similar interests discuss them, on basically all topics of interest to people with enough resources to get on-line. These are, largely inadvertently, experiments in developing collective understandings, or at least shared and structured disagreements, about these topics.
All such systems have to face tricky problems of coordinating their computational architecture, their social organization, and their cognitive functions (Shalizi, 2007; Farrell and Schwartzberg, 2008). They need ways of of making findings (or claims) accessible, of keeping discussion productive, and so forth and so on. (Often, participants are otherwise strangers to each other, which is at the least suggestive of the problems of trust and motivation which will face efforts to make mass democracy more participative.) This opens up an immense design space, which is still very poorly understood --- but almost certainly presents a rugged search landscape, with an immense number of local maxima and no very obvious path to the true peaks. (It is even possible that the landscape, and so the peaks, could vary with the subject under debate.) One of the great aspects of the current moment, for cognitive democracy, is that it has become (comparatively) very cheap and easy for such experiments to be made online, so that this design space can be explored.
There are also online ventures which are failures, and these, too, are informative. They range from poorly-designed sites which never attract (or actively repel) a user base, or produce much of value, to online groupings which are very successful in their own terms, but are, cognitively, full of fail, such as thriving communities dedicated to conspiracy theories. These are not just random, isolated eccentrics, but highly structured communities engaged in sharing and developing ideas, which just so happen to be very bad ideas. (See, for instance, Bell et al. (2006) on the networks of those who share delusions that their minds are being controlled by outside forces.) If we want to understand what makes successful online institutions work, and perhaps even draw lessons for institutional design more generally, it will help tremendously to contrast the successes with such failures.
The other great aspect for learning right now is that all these experiments are leaving incredibly detailed records. People who use these sites or systems leave detailed, machine-accessible traces of their interactions with each other, even ones which tell us about what they were thinking. This is an unprecedented flood of detail about experiments with collective cognition, and indeed with all kinds of institutions, and about how well they served various functions. Not only could we begin to just observe successes and failures, but we can probe the mechanisms behind those outcomes.
This points, we think, to a very clear constructive agenda. To exaggerate a little, it is to see how far the Internet enables modern democracies to make as much use of their citizens' minds as did Ober's Athens. We want to learn from existing online ventures in collective cognition and decision-making. We want to treat these ventures are, more or less, spontaneous experiments10, and compare the success and failures (including partial successes and failures) to learn about institutional mechanisms which work well at harnessing the cognitive diversity of large numbers of people who do not know each other well (or at all), and meet under conditions of relative equality, not hierarchy. If this succeeds, what we learn from this will provide the basis for experimenting with the re-design of democratic institutions themselves.
We have, implicitly, been viewing institutions through the lens of information-processing. To be explicit, the human actions and interactions which instantiate an institution also implement abstract computations (Hutchins, 1995). Especially when designing institutions for collective cognition and decision-making, it is important to understand them as computational processes. This brings us to our concluding suggestions about some of the ways social science and computer science can help each other.
Hong and Page's work provides a particularly clear, if abstract, formalization of the way in which diverse individual perspectives or heuristics can combine for better problem-solving. This observation is highly familiar in machine learning, where the large and rapidly-growing class of "ensemble methods" work, explicitly, by combining multiple imperfect models, which helps only because the models are different (Domingos, 1999) --- in some cases it helps exactly to the extent that the models are different (Krogh and Vedelsby, 1995). Different ensemble techniques correspond to different assumptions about the capacities of individual learners, and how to combine or communicate their predictions. The latter are typically extremely simplistic, and understanding the possibilities of non-trivial organizations for learning seems like a crucial question for both machine learning and for social science.
Democracy, we have argued, has a capacity unmatched among other macro-structures to actually experiment, and to make use of cognitive diversity in solving complex problems. To make the best use of these potentials, democratic structures must themselves be shaped so that social interaction and cognitive function reinforce each other. But the cleverest institutional design in the world will not help unless the resources --- material, social, cultural --- needed for participation are actually broadly shared. This is not, or not just, about being nice or equitable; cognitive diversity is itself a resource, a source of power, and not something we can afford to waste.
Badii, Remo and Antonio Politi (1997). Complexity: Hierarchical Structures and Scaling in Physics, Cambridge, England: Cambridge University Press.
Bell, Vaughan, Cara Maiden, Antonio Mu{~n}oz-Solomando and Venu Reddy (2006). "``Mind Control'' Experience on the {Internet}: Implications for the Psychiatric Diagnosis of Delusions", Psychopathology, vol. 39, pp. 87--91, http://arginine.spc.org/vaughan/Bell_et_al_2006_Preprint.pdf
Blume, Lawrence Blume and David Easley (2006). "If You're so Smart, Why Aren't You Rich? Belief Selection in Complete and Incomplete Markets", Econometrica, vol. 74, pp. 929--966, http://www.santafe.edu/media/workingpapers/01-06-031.pdf
Bowles, Samuel and Suresh Naidu (2008). "Persistent Institutions", working paper 08-04-015, Santa Fe Institute, http://tuvalu.santafe.edu/~bowles/PersistentInst.pdf
Domingos, Pedro (1999). "The Role of Occam's Razor in Knowledge Discovery", Data Mining and Knowledge Discovery, vol. 3, pp. 409--425, http://www.cs.washington.edu/homes/pedrod/papers/dmkd99.pdf
Farrell, Henry and Melissa Schwartzberg (2008). "Norms, Minorities, and Collective Choice Online", Ethics and International Affairs 22:4, http://www.carnegiecouncil.org/resources/journal/22_4/essays/002.html
Hacker, Jacob S. and Paul Pierson (2010). Winner-Take-All Politics: How Washington Made the Rich Richer --- And Turned Its Back on the Middle Class. New York: Simon and Schuster.
Hayek, Friedrich A. (1948). Individualism and Economic Order. Chicago: University of Chicago Press.
Hong, Lu and Scott E. Page (2004). "Groups of diverse problem solvers can outperform groups of high-ability problem solvers", Proceedings of the National Academy of Sciences, vol. 101, pp. 16385--16389, http://www.cscs.umich.edu/~spage/pnas.pdf
Huckfeldt, Robert, Paul E. Johnson and John Sprague (2004). Political Disagreement: The Survival of Diverse Opinions within Communication Networks, Cambridge, England: Cambridge University Press.
Hutchins, Edwin (1995). Cognition in the Wild. Cambridge, Massachusetts: MIT Press.
Judd, Stephen, Michael Kearns and Yevgeniy Vorobeychik (2010). "Behavioral dynamics and influence in networked coloring and consensus", Proceedings of the National Academy of Sciences, vol. 107, pp. 14978--14982, doi:10.1073/pnas.1001280107
Knight, Jack (1992). Institutions and Social Conflict, Cambridge, England: Cambridge University Press.
Knight, Jack and James Johnson (2011). The Priority of Democracy: Political Consequences of Pragmatism, Princeton: Princeton University Press.
Krogh, Anders and Jesper Vedelsby (1995). "Neural Network Ensembles, Cross Validation, and Active Learning", pp. 231--238 in G. Tesauro et al. (eds)., Advances in Neural Information Processing Systems 7 [NIPS 1994], http://books.nips.cc/papers/files/nips07/0231.pdf
Laughlin, Patrick R. (2011). Group Problem Solving. Princeton: Princeton University Press.
Lazer, David and Allan Friedman (2007). "The Network Structure of Exploration and Exploitation", Administrative Science Quarterly, vol. 52, pp. 667--694, http://www.hks.harvard.edu/davidlazer/files/papers/Lazer_Friedman_ASQ.pdf
Lindblom, Charles (1982). "The Market as Prison", The Journal of Politics, vol. 44, pp. 324--336, http://www.jstor.org/pss/2130588
Mason, Winter A., Andy Jones and Robert L. Goldstone (2008). "Propagation of Innovations in Networked Groups", Journal of Experimental Psychology: General, vol. 137, pp. 427--433, doi:10.1037/a0012798
Mason, Winter A. and Duncan J. Watts (2012). "Collaborative Learning in Networks", Proceedings of the National Academy of Sciences, vol. 109, pp. 764--769, doi:10.1073/pnas.1110069108
Mercer, Neil (2000). Words and Minds: How We Use Language to Think Together. London: Routledge.
Mercier, Hugo and Dan Sperber (2011). "Why do humans reason? Arguments for an argumentative theory", Behavioral and Brain Sciences, vol. 34, pp. 57--111, doi:10.1017/S0140525X10000968
Mitchell, Melanie (1996). An Introduction to Genetic Algorithms, Cambridge, Massachusetts: MIT Press.
Moore, Cristopher and Stephan Mertens (2011). The Nature of Computation. Oxford: Oxford University Press.
Nelson, Richard R. and Sidney G. Winter (1982). An Evolutionary Theory of Economic Change. Cambridge, Massachusetts: Harvard University Press.
Nemet, Charlan J., Bernard Personnaz, Marie Personnaz and Jack A. Goncalo (2004). "The Liberating Role of Conflict in Group Creativity: A Study in Two Countries", European Journal of Social Psychology, vol. 34, pp. 365--374, doi:10.1002/ejsp.210
Nemeth, Charlan Jeanne and Margaret Ormiston (2007). "Creative Idea Generation: Harmony versus Stimulation", European Journal of Social Psychology, vol. 37, pp. 524--535, doi:10.1002/ejsp.373
Nemeth, Charlan Jeanne (2012). "Minority Influence Theory", pp. 362--378 in P. A. M. Van Lange et al. (eds.), Handbook of Theories in Social Psychology, vol. II. New York: Sage.
Page, Scott E. Page (2011). Diversity and Complexity, Princeton: Princeton University Press.
Pfeffer, Jeffrey and Robert I. Sutton (2006). Hard Facts, Dangerous Half-Truths and Total Nonsense: Profiting from Evidence-Based Management. Boston: Harvard Business School Press.
Popper, Karl R. (1957). The Poverty of Historicism, London: Routledge.
Popper, Karl R. (1963). Conjectures and Refutations: The Growth of Scientific Knowledge, London: Routledge.
Rosenblum, Nancy (2008). On the Side of the Angels: An Appreciation of Parties and Partisanship. Princeton: Princeton University Press.
Salganik, Matthew J., Peter S. Dodds and Duncan J. Watts (2006). "Experimental study of inequality and unpredictability in an artificial cultural market", Science, vol. 311, pp. 854--856, http://www.princeton.edu/~mjs3/musiclab.shtml
Shalizi, Cosma Rohilla (2007). "Social Media as Windows on the Social Life of the Mind", in AAAI 2008 Spring Symposia: Social Information Processing, http://arxiv.org/abs/0710.4911
Shalizi, Cosma Rohilla, Kristina Lisa Klinkner and Robert Haslinger (2004). "Quantifying Self-Organization with Optimal Predictors", Physical Review Letters, vol. 93, art. 118701, http://arxiv.org/abs/nlin.AO/0409024
Shalizi, Cosma Rohilla Shalizi and Andrew C. Thomas (2011). "Homophily and Contagion Are Generically Confounded in Observational Social Network Studies", Sociological Methods and Research, vol. 40, pp. 211--239, http://arxiv.org/abs/1004.4704
Shapiro, Carl and Hal R. Varian (1998). Information Rules: A Strategic Guide to the Network Economy, Boston: Harvard Business School Press
Stiglitz, Joseph E. (2000). "The Contributions of the Economics of Information to Twentieth Century Economics", The Quarterly Journal of Economics, vol. 115, pp. 1441--1478, http://www2.gsb.columbia.edu/faculty/jstiglitz/download/papers/2000_Contributions_of_Economics.pdf
Sunstein, Cass R. (2003). Why Societies Need Dissent. Cambridge, Massachusetts: Harvard University Press.
Swartz, Aaron (2006). "Who Writes Wikipedia?", http://www.aaronsw.com/weblog/whowriteswikipedia
Two qualifications are in order. First, we don't think that justice and social order are unimportant. If our arguments imply social institutions that are either profoundly unjust or likely to cause socially devastating instability, they are open to challenge on these alternative normative criteria. Second, our normative arguments about what these institutions are good for should not be taken as an empirical statement about how these institutions have come into being. Making institutions, like making sausages and making laws, is usually an unpleasant process.[return to main text]
Much more could of course be said about the meaning of the term "complexity". In particular, it may later be useful to look at formal measures of the intrinsic complexity of problems in terms of the resources required to solve them ("computational complexity" theory, see Moore and Mertens), or the degree of behavioral flexibility of systems, such as interacting decision-makers (Badii and Politi; Shalizi, Klinkner and Haslinger). We should also note here that several decades of work in experimental psychology indicates that groups are better at problem-solving than the best individuals within the group (Laughlin, 2011). We do not emphasize this interesting experimental tradition, however, because it is largely concerned with problems which are, in our terms, rather simple, and so suitable to the psychology laboratory.[return to main text]
Imagine trying to discover whether a locally-grown tomato in Pittsburgh is better, from the point of view of greenhouse-gas emission, than one imported from Florida. After working out the differences in emissions from transport, one has to consider the emissions involved in growing the tomatoes in the first place, the emissions-cost of producing different fertilizers, farm machinery, etc., etc. The problem quickly becomes intractable --- and this is before a consumer with limited funds must decide how much a ton of emitted carbon dioxide is worth to them. Let there be a price on greenhouse-gas emission, however, and the whole informational problem disappears, or rather gets solved implicitly by ordinary market interactions.[return to main text]
"Thus bridges are built; harbours open'd; ramparts rais'd; canals form'd; fleets equip'd; and armies disciplin'd every where, by the care of government, which, tho' compos'd of men subject to all human infirmities, becomes, by one of the finest and most subtle inventions imaginable, a composition, which is, in some measure, exempted from all these infirmities." --- Hume, Treatise of Human Nature, book III, part II, sect. vii.[return to main text]
Broadly similar results have come from experiments on learning and problem-solving in controlled networks of human subjects in the laboratory (Mason et al., 2008; Judd et al., 2010; Mason and Watts, 2012). However, we are not aware of experiments on human subjects which have deliberately varied network structure in a way directly comparable to Lazer and Friedman's simulations. We also note that using multiple semi-isolated sub-populations ("islands") is a common trick in evolutionary optimization, precisely to prevent premature convergence on sub-optimal solution (Mitchell, 1996).[return to main text]
This resonates with Karl Popper's insistence (1957, 1963) that, to the extent science is rational and objective, it is not because individual scientists are disinterested, rational, etc. --- he knew perfectly well that individual scientists are often pig-headed and blinkered --- but because of the way the social organization of scientific communities channels scientists' ambition and contentiousness. The reliability of science is an emergent property of scientific institutions, not of scientists.[return to main text]
Bureaucracies can do experiments, such as field trials of new policies, or "A/B" tests of new procedures, now quite common with Internet companies. (See, e.g., the discussion of such experiments in Pfeffer and Sutton.) Power hierarchies, however, are big obstacles to experimenting with options which would upset those power relations, or threaten the interests of those high in the hierarchy. Market-based selection of variants (explored by Nelson and Winter, 1982) also has serious limits (see e.g., Blume and Easley). There are, after all, many reasons why there are no markets in alternative institutions. E.g., even if such a market could get started, it would be a prime candidate efficiency-destroying network externalities, leading at best to monopolistic competition. (Cf. Shapiro and Varian's advice to businesses about manipulating standards-setting processes.)[return to main text]
Empirically, most of the content of Wikipedia seems to come from a large number of users each of whom makes a substantial contribution or contributions to a very small number of articles. The needed formatting, clean-up, coordination, etc., on the other hand, comes disproportionately from a rather small number of users very dedicated to Wikipedia (see Swartz, 2006). On the role of internal norms and power in the way Wikipedia works, see Farrell and Schwartzberg (2008).[return to main text]
For an enthusiastic and intelligent account of ways in which the Internet might be used to enhance the practice of science, see Nielsen. (We cannot adequately explore, here, how scientific disciplines fit into our account of institutions and democratic processes.)[return to main text]
Obviously, the institutions people volunteer to participate in on-line will depend on their pre-existing characteristics, and it would be naive to ignore this. We cannot here go into strategies for causal inference in the face of such endogenous selection bias, which is pretty much inescapable in social networks (Shalizi and Thomas, 2011). Deliberate experimentation with online institutional arrangements is attractive, if it could be done effectively and ethically (cf. Salganik et al., 2006).[return to main text]
Manual trackback: 3 Quarks Daily; The Debate Link; Boing-Boing; MetaFilter (appropriately enough); Quomodocumque; Sunlight Foundation; Matthew Yglesias; Cows and Graveyards; Dead Voles; Bookforum; ABC Democracy; Schools as Ecosystems
Update, 29 May 2012: Added some references to the bibliography.
The Collective Use and Evolution of Concepts; The Progressive Forces
Posted by crshalizi at May 23, 2012 15:00 | permanent link
Attention conservation notice: 1400 words on a friend's proposal to do away with peer review, written many weeks ago when there was actually some debate about this.
Larry is writing about peer review (again), this time to advocate "A World Without Referees". Every scientist, of course, has day-dreamed about this, in a first-lets-kill-all-the-lawyers way, but Larry is serious, so let's treat this seriously. I'm not going to summarize his argument; it's short and you can and should go read it yourself.
I think it helps, when thinking about this, to separate two functions peer-reviewed journals and conferences have traditionally served. One is spreading claims (dissemination), and the other is letting readers know about claims worthy of their attention (certification).
Arxiv, or something like it, can take over dissemination handily. Making copies of papers is now very cheap and very fast, so we no longer have to be choosy about which ones we disseminate. In physics, this use of Arxiv is just as well-established as Larry says. In fact, one reason Arxiv was able to establish itself so rapidly and thoroughly among physicists was that they already had a well-entrenched culture of circulating preprints long before journal publication. What Arxiv did was make this public and universally accessible.
But physicists still rely on journals for certification. People pay more attention to papers which come out in Physical Review Letters, or even just Physical Review E, than ones which are only on Arxiv. "Could it make it past peer review?" is used by many people as a filter to weed out the stuff which is too wrong or too unimportant to bother with. This doesn't work so well for those directly concerned with a particular research topic, but if something is only peripherally of interest, it makes a lot of sense.
Even within a specialized research community, consisting entirely of experts who can evaluate new contributions on their own, there is a rankling inefficiency to the world without referees. Larry talks about spending a minute or two looking at new stats. papers on Arxiv every day. But everyone filtering Arxiv for themselves is going to get harder and harder as more potentially-relevant stuff gets put on it. I'm interested in information theory, so I've long looked at cs.IT, and it's become notably more time-consuming as that community has embraced the Arxiv. Yet within any given epistemic community, lots of people are going to be applying very similar filters. So the world-without-referees has an increasing amount o work being done by individuals, but a lot of that work is redundant. Efficiency, the division of labor, points to having a few people put their time into filtering, and the rest of us relying on it, even when in principle we could do the filtering ourselves. To be fair, of course, we should probably take this job in turns...
So: if all papers get put on Arxiv, filtering becomes a big job, so efficiency pushes us towards having only some members of the research community do the filtering for the rest. We have re-invented something very much like peer review, purely so that our lives are not completely consumed by evaluating new papers, and we can actually get some work done.
Larry's proposal for a world without referees also doesn't seem to take into account the needs of researchers to rely on findings in fields in which they are not experts, and so can't act as their own filters. (Or they could if they put in a few years in something else first.) If I need some result from neuroscience, or for that matter from topology, I do not have the time to spend becoming a neuroscientist or topologist, and it is an immense benefit to have institutions I can trust to tell me "these claims about cortical columns, or locally compact Hausdorff spaces, are at least not crazy". This is also a kind of filtering, and there is the same push, based on the division of labor, to rely on only some neuroscientists or topologists to do the filtering for outsiders (or all of them only some of the time), and again we have re-created something very much like refereeing.
So: some form or forms of filtering is inevitable, and the forces pushing for a division of labor in filtering are very strong. I don't know of any reason to think that the current, historically-evolved peer review system is the best way of organizing this cognitive triage, but we're not going to avoid having some such system, nor should we want to. Different ways of organizing the work of filtering will have different costs and benefits, but we should be talking about those and those trade-offs, not hoping that we can just wish the problem away now that making copies is cheap1. It's not at all obvious, for instance, that attention-filtering for the internal benefit of members of a research community should be done in the same way as reliability-filtering for outsiders. But, to repeat, we are going to have filters and they are almost certainly going to involve a division of labor.
Lenin, supposedly, said that "small production engenders capitalism and the bourgeoisie daily, hourly, spontaneously and on a mass scale" (Nove, The Economics of Feasible Socialism Revisited, p. 46). Whether he was right about the bourgeoisie or not, the rate of production of the scientific literature, the similarity of interests and standards with a community, and the need to rely on other field's findings are all doing to engender refereeing-like institutions, "daily, hourly, spontaneously and on a mass scale". I don't think Larry would go to the same lengths to get rid of referees that Lenin went to get rid of the bourgeoisie, but in any case the truly progressive course is not to suppress the old system by force, but to provide a superior alternative.
Speaking personally, I am attracted to a scenario we might call "peer review among consenting adults". Let anyone put anything on Arxiv (modulo the usual crank-screen). But then let others create filtered versions, applying such standards of topic, rigor, applicability, writing quality, etc., as they please --- and be explicit about what those standards are. These can be layered as deep as their audience can support. Presumably the later filters would be intended for those further from active research in the area, and so would be less tolerant of false alarms, and more tolerant of missing possible discoveries, than the filters for those close to the work. But this could be an area for experiment, and for seeing what people actually find useful. This is, I take it, more or less what Paul Ginsparg proposes, and it has a lot to recommend it. Every contribution is available if anyone wants to read it, but no one is compelled to try to filter the whole flow of the scholarly literature unaided, and human intelligence can still be used to amplify interesting signals, or even to improve papers.
Attractive as I find this idea, I am not saying it is historically inevitable, or even the best possible way of ordering these matters. The main point is that peer review does some very important jobs for the community of inquirers (whether or not it evolved to do them), and that if we want to get rid of it, it would be a good idea to have something else ready to do those jobs.
[1]: For instance, many people have suggested that referees should have to take responsibility, in some way, for their reports, so that those who do sloppy or ignorant or merely-partisan work will be at least shamed. There is genuinely a lot to be said for this. But it does run into the conflicting demand that science should not be a respecter of persons --- if Grand Poo-Bah X writes a crappy paper, people should be able to call X on it, without fear of retribution or considering the (inevitable) internal politics of the discipline and the job-market. I do not know if there is a way to reconcile these, but that's one of the kind of trade-offs we have to consider as we try to re-design this institution. ^ Manual trackback: Fernando Pereira
Learned Folly; Kith and Kin; The Collective Use and Evolution of Concepts
Posted by crshalizi at May 21, 2012 02:00 | permanent link
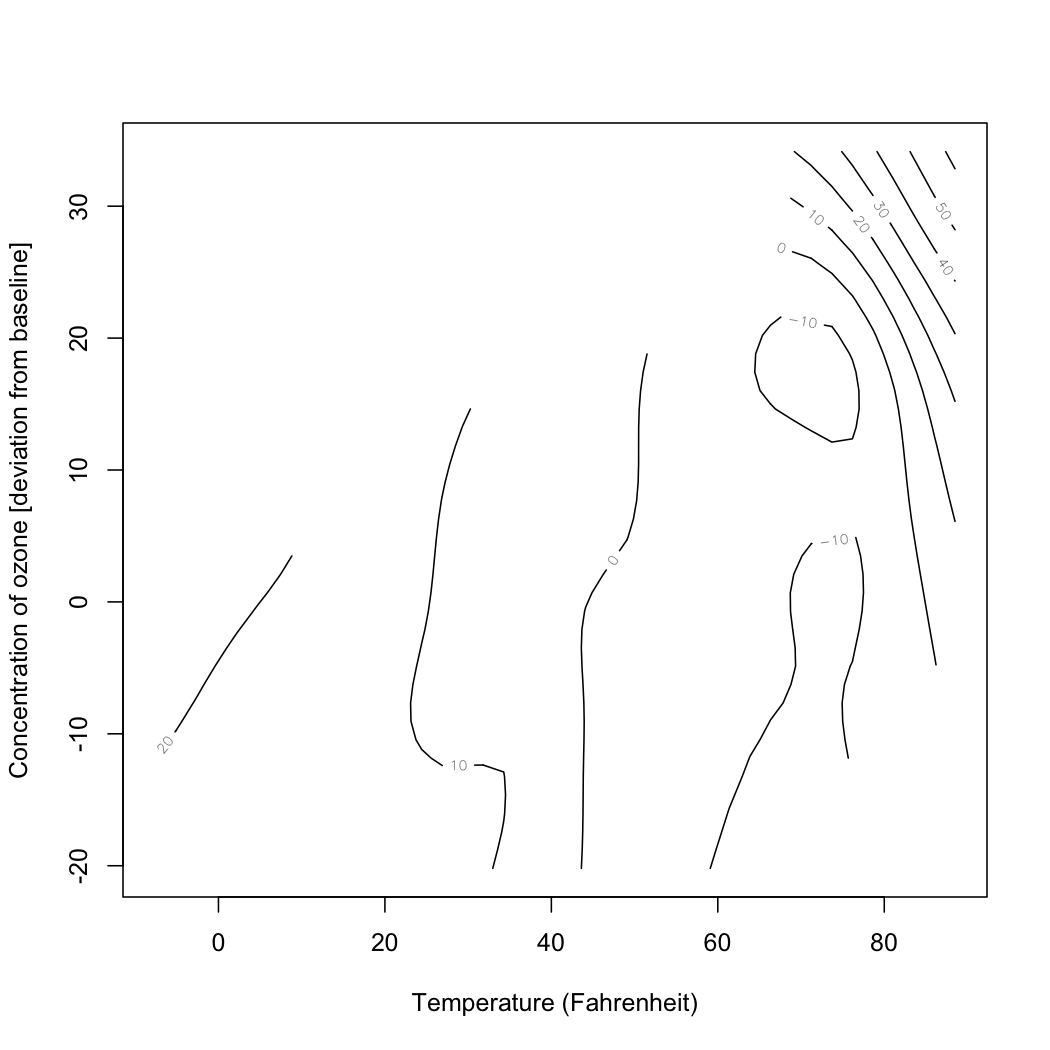
Sometimes, all you can do is quote verbatim* from your inbox:
Date: Tue, 17 Apr 2012 09:31:57 -0400 From: Stephen Wolfram To: Cosma Shalizi Subject: 10-year followup on "A New Kind of Science" Next month it'll be 10 years since I published "A New Kind of Science" ... and I'm planning to take stock of the decade of commentary, feedback and follow-on work about the book that's appeared. My archives show that you wrote an early review of the book: http://www.cscs.umich.edu/~crshalizi/reviews/wolfram/ At the time reviews like yours appeared, most of the modern web apparatus for response and public discussion had not yet developed. But now it has, and there seems to be considerable interest in the community in me using that venue to give my responses and comments to early reviews. I'm writing to ask if there's more you'd like to add before I embark on my analysis in the next week or so. I'd like to take this opportunity to thank you for the work you put into writing a review of my book. I know it was a challenge to review a book of its size, especially quickly. I plan to read all reviews with forbearance, and hope that---especially leavened by the passage of a decade---useful intellectual points can be derived from discussing them. If you don't have anything to add to your early review, it'd be very helpful to know that as soon as possible. Thanks in advance for your help. -- Stephen Wolfram P.S. Nowadays you can find the whole book online at http://www.wolframscience.com/nksonline/toc.html If you'd like a new physical copy, just let me know and I can have it shipped...
I wrote my my review in 2002 (though I didn't put it out until 2005). The idea that complex patterns can arise from simple rules was already old then, and has only become more commonplace since. A lot of interesting, substantive, specific science has been done on that theme in the ensuing decade. To this effort, neither Wolfram nor his book have contributed anything of any note. The one respect in which I was overly pessimistic is that I have not, in fact, had to spend much time "de-programming students [who] read A New Kind of Science before knowing any better" — but I get a rather different class of students these days than I did in 2002.
Otherwise, and for the record, I do indeed still stand behind the review.
Manual trackback: Hacker News; Wolfgang; Andrew Gelman
*: I removed our e-mail addresses, because no one deserves spam.
Posted by crshalizi at May 03, 2012 23:10 | permanent link
Attention conservation notice: Boring details about getting finicky statistical software to work; or, please read the friendly manual.
Some of my students are finding it difficult to install the R package pcalg; I share these instructions in case others are also in difficulty.
source("http://bioconductor.org/biocLite.R")(Since RBGL depends on graph, this should automatically also install graph; if not, run biocLite("graph"), then biocLite("RBGL").)
biocLite("RBGL")
You can still extract the graph by hand from the fitted models returned by functions like pc --- if one of those objects is fit, then fit@graph@edgeL is a list of lists, where each node has its own list, naming the other nodes it has arrows to (not from). If you are doing this for the final in ADA, you don't actually need anything beyond this to do the assignment, as explained in question A1a.
source("http://bioconductor.org/biocLite.R")The README for Rgraphviz gives some checks which you should be able to run if everything is working; try them.
biocLite("Rgraphviz")
When I installed pcalg on my laptop two weeks ago, it was painless, because (1) I already had graphviz, and (2) I knew about BioConductor. (In fact, the R graphical interface on the Mac will switch between installing packages from CRAN and from BioConductor.) To check these instructions, I just now deleted all the packages from my computer and re-installed them, and everything worked; elapsed time, ten minutes, mostly downloading.
Posted by crshalizi at May 02, 2012 21:30 | permanent link
In which we are devoted to two problems of political economy, viz., strikes, and macroeconomic forecasting.
Posted by crshalizi at May 01, 2012 10:31 | permanent link
What time series are. Properties: autocorrelation or serial correlation; other notions of serial dependence; strong and weak stationarity. The correlation time and the world's simplest ergodic theorem; effective sample size. The meaning of ergodicity: a single increasing long time series becomes representative of the whole process. Conditional probability estimates; Markov models; the meaning of the Markov property. Autoregressive models, especially additive autoregressions; conditional variance estimates. Bootstrapping time series. Trends and de-trending.
Posted by crshalizi at May 01, 2012 10:30 | permanent link
Attention conservation notice: I have no taste.
Now, why do the various animals do what seem to us such strange things, in the presence of such outlandish stimuli? Why does the hen, for example, submit herself to the tedium of incubating such a fearfully uninteresting set of objects as a nestful of eggs, unless she have some sort of a prophetic inkling of the result? The only answer is ad hominem. We can only interpret the instincts of brutes by what we know of instincts in ourselves. Why do men always lie down, when they can, on soft beds rather than on hard floors? Why do they sit round the stove on a cold day? Why, in a, room, do they place themselves, ninety-nine times out of a hundred, with their faces towards its middle rather than to the wall? Why do they prefer saddle of mutton and champagne to hard-tack and ditch-water? Why does the maiden interest the youth so that everything about her seems more important and significant than anything else in the world? Nothing more can be said than that these are human ways, and that every creature likes its own ways, and takes to the following them as a, matter of course. Science may come and consider these ways, and find that most of them are useful. But it is not for the sake of their utility that they are followed, but because at the moment of following them we feel that that is the only appropriate and natural thing to do. Not one man in a billion, when taking his dinner, ever thinks of utility. He eats because the food tastes good and makes him want more. If you ask him why he should want to eat more of what tastes like that, instead of revering you as a philosopher he will probably laugh at you for a fool. The connection between the savory sensation and the act it awakens is for him absolute and selbstverständlich, an "a priori synthesis" of the most perfect sort, needing no proof but its own evidence. It takes, in short, what Berkeley calls a mind debauched by learning to carry the process of making the natural seem strange, so far as to ask for the why of any instinctive human act. To the metaphysician alone can such questions occur as: Why do we smile, when pleased, and not scowl? Why are we unable to talk to a crowd as we talk to a single friend? Why does a particular maiden turn our wits so upside-down? The common man can only say, "Of course we smile, of course our heart palpitates at the sight of the crowd, of course we love the maiden, that beautiful soul clad in that perfect form, so palpably and flagrantly made from all eternity to be loved!"More soberly, or at least with fewer hens and maggots, this is highly reminiscent of Robert Frank's Passion within Reason, which I do not believe Williams mentions. ^
And so, probably, does each animal feel about the particular things it tends to do in presence of particular objects. They, too, are a priori syntheses. To the lion it is the lioness which is made to be loved; to the bear, the she-bear. To the broody hen the notion would probably seem monstrous that there should be a creature in the world to whom a nestful of eggs was not the utterly fascinating and precious and never-to-be-too-much-sat-upon object which it is to her.
Thus we may be sure that, however mysterious some animals' instincts may appear to us, our instincts will appear no less mysterious to them. And we may conclude that, to the animal which obeys it, every impulse and every step of every instinct shines with its own sufficient light, end seems at the moment the only eternally right and proper thing to do. It is done for its own sake exclusively. What voluptuous thrill may not shake a fly, when she at last discovers the one particular leaf, or carrion, or bit of dung, that out of all the world can stimulate her ovipositor to its discharge? Does not the discharge then seem to her the only fitting thing? And need she care or know anything about the future maggot and its food?
Books to Read While the Algae Grow in Your Fur; Scientifiction and Fantastica; Pleasures of Detection, Portraits of Crime; Enigmas of Chance; Central Asia; Philosophy
Posted by crshalizi at April 30, 2012 23:59 | permanent link
In which the arts of estimating causal effects from observational data are practiced on Sesame Street.
Posted by crshalizi at April 24, 2012 10:31 | permanent link
Estimating graphical models: substituting consistent estimators into the formulas for front and back door identification; average effects and regression; tricks to avoid estimating marginal distributions; propensity scores and matching and propensity scores as computational short-cuts in back-door adjustment. Instrumental variables estimation: the Wald estimator, two-stage least-squares. Summary recommendations for estimating causal effects.
Reading: Notes, chapter 24
Posted by crshalizi at April 24, 2012 10:30 | permanent link
In which we use graphical causal models to understand twin studies and variance components.
Posted by crshalizi at April 22, 2012 12:00 | permanent link
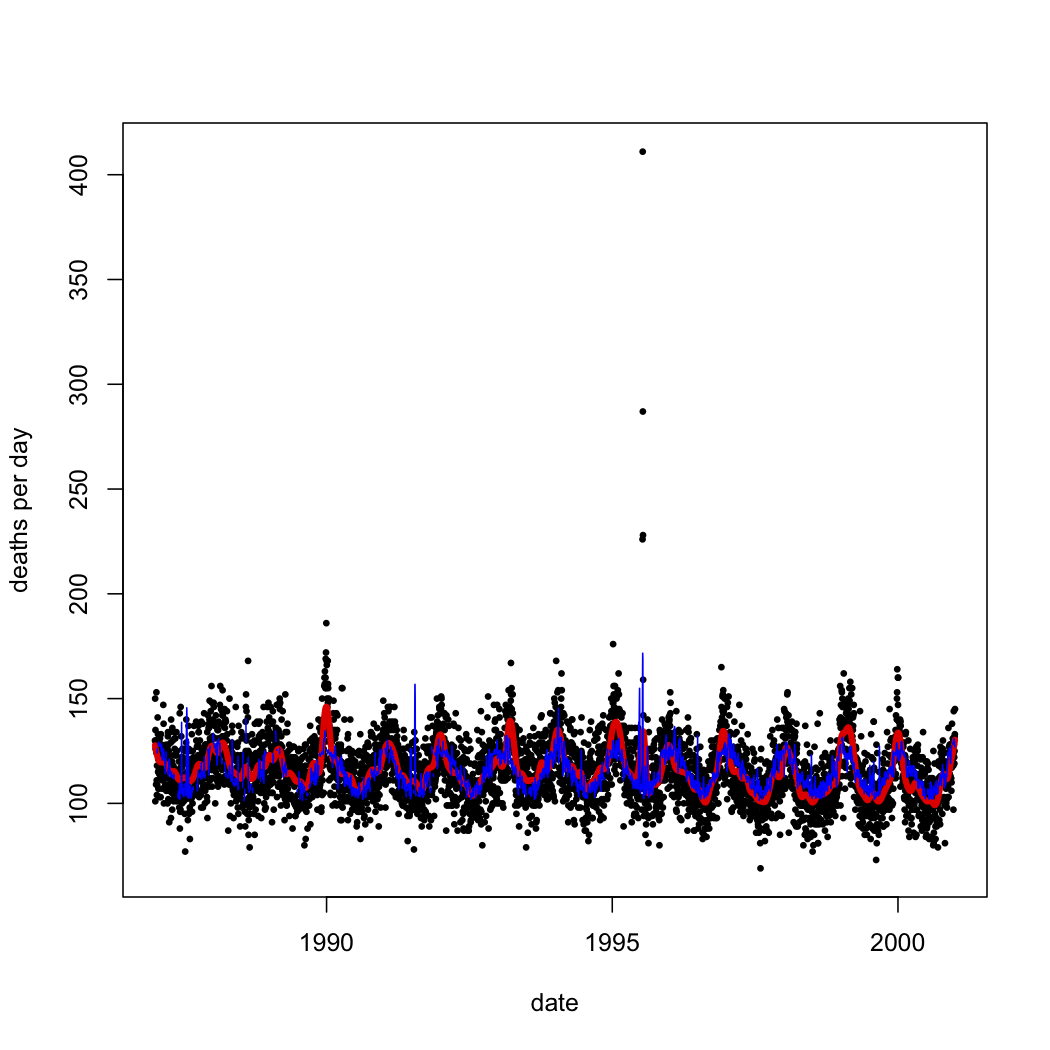
Reprise of causal effects vs. probabilistic conditioning. "Why think, when you can do the experiment?" Experimentation by controlling everything (Galileo) and by randomizing (Fisher). Confounding and identifiability. The back-door criterion for identifying causal effects: condition on covariates which block undesired paths. The front-door criterion for identification: find isolated and exhaustive causal mechanisms. Deciding how many black boxes to open up. Instrumental variables for identification: finding some exogenous source of variation and tracing its effects. Critique of instrumental variables: vital role of theory, its fragility, consequences of weak instruments. Irremovable confounding: an example with the detection of social influence; the possibility of bounding unidentifiable effects. Summary recommendations for identifying causal effects.
Reading: Notes, chapter 23
Posted by crshalizi at April 21, 2012 12:00 | permanent link
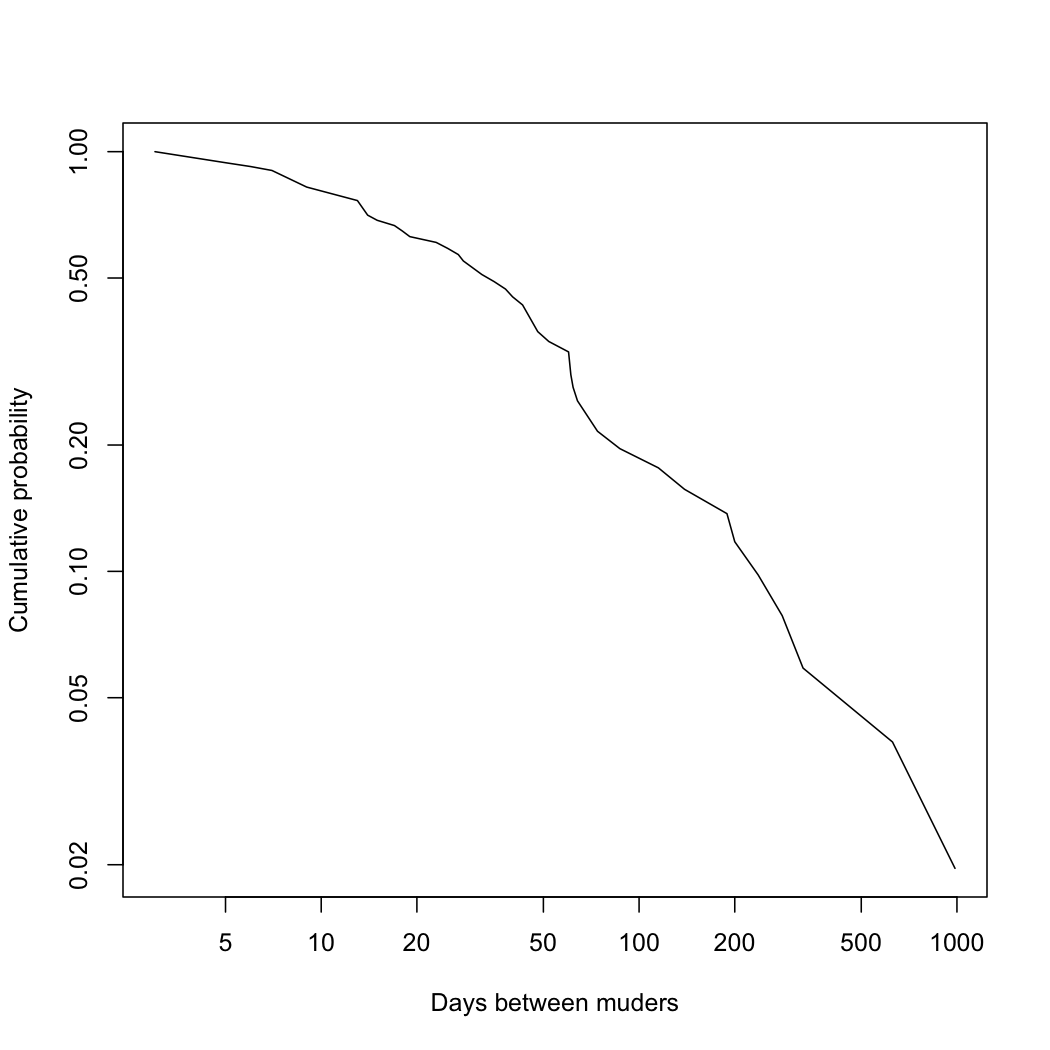
Attention conservation notice: 2500+ words on estimating how quickly time series forget their own history. Only of interest if you care about the intersection of stochastic processes and statistical learning theory. Full of jargon, equations, log-rolling and self-promotion, yet utterly abstract.
I promised to say something about the content of Daniel's thesis, so let me talk about two of his papers, which go into chapter 4; there is a short conference version and a long journal version.
Recall the world's simplest ergodic theorem: if \( X_t \) is a sequence of random variables with common expectation \( m \) and variance \( v \), and stationary covariance \( \mathrm{Cov}[X_t, X_{t+h}] = c_h \). Then the time average \( \overline{X}_n \equiv \frac{1}{n}\sum_{i=1}^{n}{X_i} \) also has expectation \( m \), and the question is whether it converges on that expectation. The world's simplest ergodic theorem asserts that if the correlation time \[ T = \frac{\sum_{h=1}^{\infty}{|c_h|}}{v} < \infty \] then \[ \mathrm{Var}\left[ \overline{X}_n \right] \leq \frac{v}{n}(1+2T) \]
Since, as I said, the expectation of \( \overline{X}_n \) is \( m \) and its variance is going to zero, we say that \( \overline{X}_n \rightarrow m \) "in mean square".
From this, we can get a crude but often effective deviation inequality, using Chebyshev's inequality: \[ \Pr{\left(|\overline{X}_n - m| > \epsilon\right)} \leq \frac{v}{\epsilon^2}\frac{1+2T}{n} \]
The meaning of the condition that the correlation time \( T \) be finite is that the correlations themselves have to trail off as we consider events which are widely separated in time — they don't ever have to be zero, but they do need to get smaller and smaller as the separation \( h \) grows. (One can actually weaken the requirement on the covariance function to just \( \lim_{n\rightarrow \infty}{\frac{1}{n}\sum_{h=1}^{n}{c_h}} = 0 \), but this would take us too far afield.) In fact, as these formulas show, the convergence looks just like what we'd see for independent data, only with \( \frac{n}{1+2T} \) samples instead of \( n \), so we call the former the effective sample size.
All of this is about the convergence of averages of \( X_t \), and based on its covariance function \( c_h \). What if we care not about \( X \) but about \( f(X) \)? The same idea would apply, but unless \( f \) is linear, we can't easily get its covariance function from \( c_h \). The mathematicians' solution to this has been to invent stronger notions of decay-of-correlations, called "mixing". Very roughly speaking, we say that \( X \) is mixing when, if you pick any two (nice) functions \( f \) and \( g \), I can always show that \[ \lim_{h\rightarrow\infty}{\mathrm{Cov}\left[ f(X_t), g(X_{t+h}) \right]} = 0 \]
Note (or believe) that this is "convergence in distribution"; it happens if, and only if, the distribution of events up to time \( t \) is becoming independent of the distribution of events from time \( t+h \) onwards.
To get useful results, it is necessary to quantify mixing, which is usually done through somewhat stronger notions of dependence. (Unfortunately, none of these have meaningful names. The review by Bradley ought to be the standard reference.) For instance, the "total variation" or \( L_1 \) distance between probability measures \( P \) and \( Q \), with densities \( p \) and \( q \) is, \[ d_{TV}(P,Q) = \frac{1}{2}\int{|p(u) - q(u)| du} \] This has several interpretations, but the easiest to grasp is that it says how much \( P \) and \( Q \) can differ in the probability they give to any one event: for any \( E \), \( d_{TV}(P,Q) \geq |P(E) - Q(E)| \). One use of this distance is to measure how the dependence between random variables, by seeing far their joint distribution is from the product of their marginal distributions. Abusing notation a little to write \( P(U,V) \) for the joint distribution of \( U \) and \( V \), we measure dependence as \[ \beta(U,V) \equiv d_{TV}(P(U,V), P(U) \otimes P(V)) = \frac{1}{2}\int{|p(u,v)-p(u)p(v)|du dv} \] This will be zero just when \( U \) and \( V \) are statistically independent, and one when, on average, conditioning on \( U \) confines \( V \) to a set which would otherwise have probability zero. (For instance if \( U \) has a continuous distribution and \( V \) is a function of \( U \) — or one of two randomly chosen functions of \( U \).)
We can relate this back to the earlier idea of correlations between functions by realizing that \[ \beta(U,V) = \sup_{|r|\leq 1}{\left|\int{r(u,v) dP(U,V)} - \int{r(u,v)dP(U)dP(V)}\right|} ~, \] that \( \beta \) says how much the expected value of a bounded function \( r \) could change between the dependent and the independent distributions. (There is no assumption that the test function \( r \) factorizes, and in fact it's important to allow \( r(u,v) \neq f(u)g(v) \).)
We apply these ideas to time series by looking at the dependence between the past and the future: \[ \begin{eqnarray*} \beta(h) & \equiv & d_{TV}(P(X^t_{-\infty}, X_{t+h}^{\infty}), P(X^t_{-\infty}) \otimes P(X_{t+h}^{\infty})) \\ & = & \frac{1}{2}\int{|p(x^t_{-\infty},x_{t+h}^{\infty})-p(x^t_{-\infty})p(x^{\infty}_{t+h})|dx^t_{-\infty}dx^{\infty}_{t+h}} \end{eqnarray*} \] (By stationarity, the integral actually does not depend on \( t \).) When \( \beta(h) \rightarrow 0 \) as \( h \rightarrow \infty \), we have a "beta-mixing" process. (These are also called "absolutely regular".) Convergence in total variation implies convergence in distribution, but not vice versa, so beta-mixing is stronger than common-or-garden mixing.
Notions like beta-mixing were originally introduced purely for probabilistic convenience, to handle questions like "when does the central limit theorem hold for stochastic processes?" These are interesting for people who like stochastic processes, or indeed for those who want to do Markov chain Monte Carlo and want to know how long to let the chain run. For our purposes, though, what's important is that when people in statistical learning theory have given serious attention to dependent data, they have usually relied on a beta-mixing assumption.
The reason for this focus on beta-mixing is that it "plays nicely" with approximating dependent processes by independent ones. The usual form of such arguments is as follows. We want to prove a result about our dependent but mixing process \( X \). For instance, we realize that our favorite prediction model will tend to do worse out-of-sample than on the data used to fit it, and we might want to bound the probability that this over-fitting will exceed \( \epsilon \). If we know the beta-mixing coefficients \( \beta(h) \), we can pick a separation, call it \( a \), where \( \beta(a) \) is reasonably small. Now we divide \( X \) up into \( \mu = n/a \) blocks of length \( a \). If we take every other block, they're nearly independent of each other (because \( \beta(a) \) is small) but not quite (because \( \beta(a) \neq 0 \)). Introduce a (fictitious) random sequence \( Y \), where blocks of length \( a \) have the same distribution as the blocks in \( X \), but there's no dependence between blocks. Since \( Y \) is an IID process, it is easy for us to prove that, for instance, the probability of over-fitting \( Y \) by more than \( \epsilon \) is at most some small \( \delta(\epsilon,\mu/2) \). Since \( \beta \) tells us about how well dependent probabilities are approximated by independent ones, the probability of the bad event happening with the dependent data is at most \( \delta(\epsilon,\mu/2) + (\mu/2)\beta(a) \). We can make this as small as we like by letting \( \mu \) and \( a \) both grow as the time series gets longer. Basically, anything result which holds for an IID process will also hold for a beta-mixing one, with a penalty in the probability that depends on \( \beta \). There are some details to fill in here (how to pick the separation \( a \)? should the blocks always be the same length as the "filler" between blocks?), but this is the basic frame.
What it leaves open, however, is how to estimate the mixing coefficients \( \beta(h) \). For Markov models, one could it principle calculate it from the transition probabilities. For more general processes, though, calculating beta from the known distribution is not easy. In fact, we are not aware of any previous work on estimating the \( \beta(h) \) coefficients from observational data. (References welcome!) Because of this, even in learning theory, people have just assumed that the mixing coefficients were known, or that it was known they went to zero at a certain rate. This was not enough for what we wanted to do, which was actually calculate bounds on error from data.
There were two tricks to actually coming up with an estimator. The first was to reduce the ambitions a little bit. If you look at the equation for \( \beta(h) \) above, you'll see that it involves integrating over the infinite-dimensional distribution. This is daunting, so instead of looking at the whole past and future, we'll introduce a horizon, \( d \) steps away, and cut things off there: \[ \begin{eqnarray*} \beta^{(d)}(h) & \equiv & d_{TV}(P(X^t_{t-d}, X_{t+h}^{t+h+d}), P(X^t_{t-d}) \otimes P(X_{t+h}^{t+h+d})) \\ & = & \frac{1}{2}\int{|p(x^t_{t-d},x_{t+h}^{t+h+d})-p(x^t_{t-d})p(x^{t+h+d}_{t+h})|dx^t_{t-d}dx^{t+h+d}_{t+h}} \end{eqnarray*} \] If \( X \) is a Markov process, then there's no difference between \( \beta^{(d)}(h) \) and \( \beta(h) \). If \( X \) is a Markov process of order \( p \), then \( \beta^{(d)}(h) = \beta(h) \) once \( d \geq p \). If \( X \) is not Markov at any order, it is still the case that \( \beta^{(d)}(h) \rightarrow \beta(h) \) as \( d \) grows. So we have an approximation to \( \beta \) which only involves finite-dimensional integrals, which we might have some hope of doing.
The other trick is to get rid of those integrals. Another way of writing the beta-dependence between the random variables \( U \) and \( V \) is \[ \beta(U,V) = \sup_{\mathcal{A},\mathcal{B}}{\frac{1}{2}\sum_{a\in\mathcal{A}}{\sum_{b\in\mathcal{B}}{\left| \Pr{(a \cap b)} - \Pr{(a)}\Pr{(b)} \right|}}} \] where \( \mathcal{A} \) runs over finite partitions of values of \( U \), and \( \mathcal{B} \) likewise runs over finite partitions of values of \( V \). I won't try to show that this formula is equivalent to the earlier definition, but I will contend that if you think about how that integral gets cashed out as a sum, you can sort of see how it would be. If we want \( \beta^{(d)}(h) \), we can take \( U = X^{t}_{t-d} \) and \( V = X^{t+h+d}_{t+h} \), and we could find the dependence by taking the supremum over partitions of those two variables.
Now, suppose that the joint density \( p(x^t_{t-d},x_{t+h}^{t+h+d}) \) was piecewise constant, with those pieces being rectangles parallel to the coordinate axes. Then sub-dividing those rectangles would not change the sum, and the \( \sup \) would actually be attained for that particular partition. Most densities are not of course piecewise constant, but we can approximate them by such piecewise-constant functions, and make the approximation arbitrarily close (in total variation). More, we can estimate those piecewise-constant approximating densities from a time series. Those estimates are, simply, histograms, which are about the oldest form of density estimation. We show that histogram density estimates converge in total variation on the true densities, when the bin-width is allowed to shrink as we get more data.
Because the total variation distance is in fact a metric, we can use the triangle inequality to get an upper bound on the true beta coefficient, in terms of the beta coefficients of the estimated histograms, and the expected error of the histogram estimates. All of the error terms shrink to zero as the time series gets longer, so we end up with consistent estimates of \( \beta^{(d)}(h) \). That's enough if we have a Markov process, but in general we don't. So we can let \( d \) grow as \( n \) does, and that (after a surprisingly long measure-theoretic argument) turns out to do the job: our histogram estimates of \( \beta^{(d)}(h) \), with suitably-growing \( d \), converge on the true \( \beta(h) \).
To confirm that this works, the papers go through some simulation examples, where it's possible to cross-check our estimates. We can of course also do this for empirical time series. For instance, in his this Daniel took four standard macroeconomic time series for the US (GDP, consumption, investment, and hours worked, all de-trended in the usual way). This data goes back to 1948, and is measured four times a year, so there are 255 quarterly observations. Daniel estimated a \( \beta \) of 0.26 at one quarter's separation, \( \widehat{\beta}(2) = 0.15 \), \( \widehat{\beta}(3) = 0.02 \), and somewhere between 0 and 0.11 for \(\widehat{\beta}(4) \). (That last is a sign that we don't have enough data to go beyond \( h = 4 \).) Optimistically assuming no dependence beyond a year, one can calculate the effective number of independent data points, which is not 255 but 31. This has morals for macroeconomics which are worth dwelling on, but that will have to wait for another time. (Spoiler: \( \sqrt{\frac{1}{31}} \approx 0.18 \), and that's if you're lucky.)
It's inelegant to have to construct histograms when all we want is a single number, so it wouldn't surprise us if there were a slicker way of doing this. (For estimating mutual information, which is in many ways analogous, estimating the joint distribution as an intermediate step is neither necessary nor desirable.) But for now, we can do it, when we couldn't before.
Posted by crshalizi at April 20, 2012 14:57 | permanent link
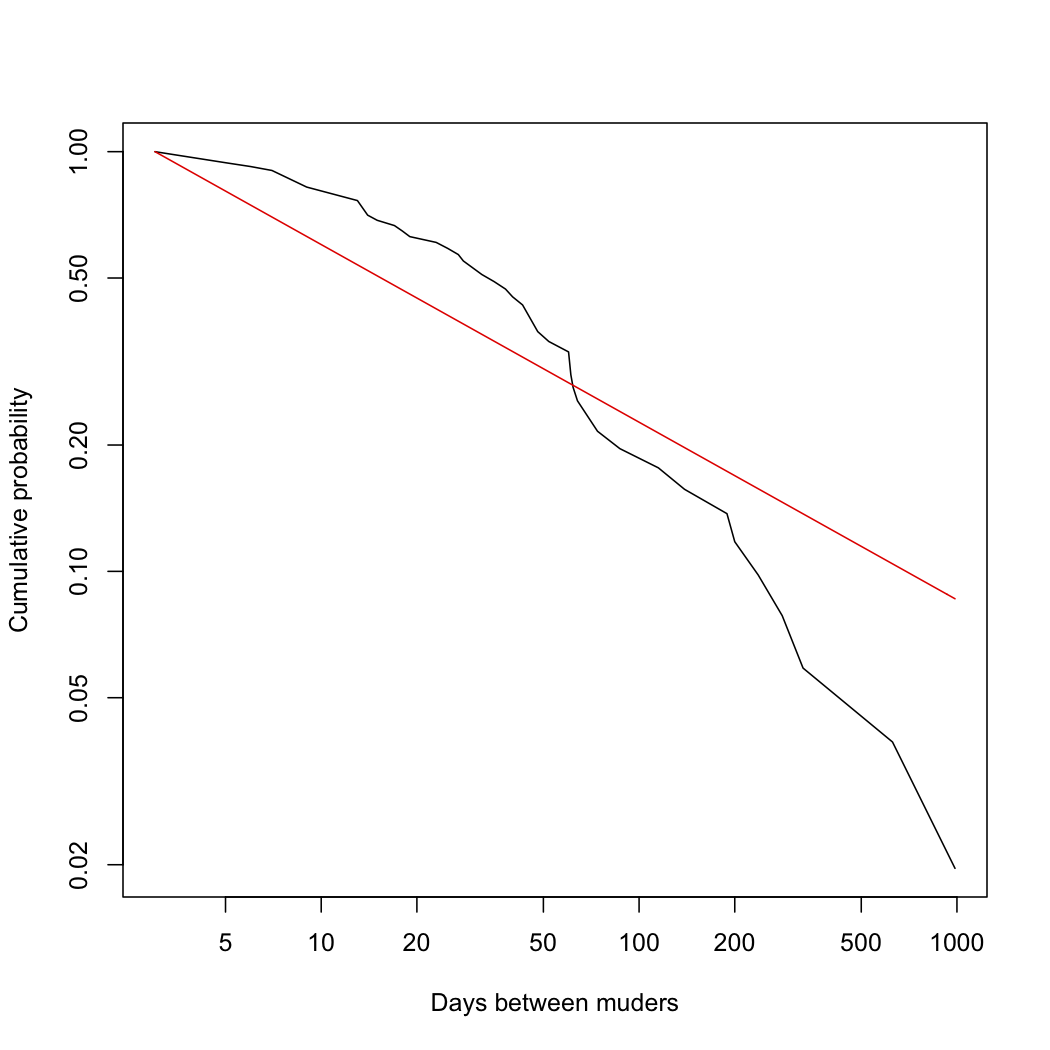
Probabilistic prediction is about passively selecting a sub-ensemble, leaving all the mechanisms in place, and seeing what turns up after applying that filter. Causal prediction is about actively producing a new ensemble, and seeing what would happen if something were to change ("counterfactuals"). Graphical causal models are a way of reasoning about causal prediction; their algebraic counterparts are structural equation models (generally nonlinear and non-Gaussian). The causal Markov property. Faithfulness. Performing causal prediction by "surgery" on causal graphical models. The d-separation criterion. Path diagram rules for linear models.
Reading: Notes, chapter 22
Posted by crshalizi at April 15, 2012 20:03 | permanent link
In which the analysis of multivariate data is recursively applied.
Reading: Notes, assignment
Posted by crshalizi at April 15, 2012 20:02 | permanent link
Conditional independence and dependence properties in factor models. The generalization to graphical models. Directed acyclic graphs. DAG models. Factor, mixture, and Markov models as DAGs. The graphical Markov property. Reading conditional independence properties from a DAG. Creating conditional dependence properties from a DAG. Statistical aspects of DAGs. Reasoning with DAGs; does asbestos whiten teeth?
Reading: Notes, chapter 21
Posted by crshalizi at April 15, 2012 20:01 | permanent link
From factor analysis to mixture models by allowing the latent variable to be discrete. From kernel density estimation to mixture models by reducing the number of points with copies of the kernel. Probabilistic formulation of mixture models. Geometry: planes again. Probabilistic clustering. Estimation of mixture models by maximum likelihood, and why it leads to a vicious circle. The expectation-maximization (EM, Baum-Welch) algorithm replaces the vicious circle with iterative approximation. More on the EM algorithm: convexity, Jensen's inequality, optimizing a lower bound, proving that each step of EM increases the likelihood. Mixtures of regressions. Other extensions.
Extended example: Precipitation in Snoqualmie Falls revisited. Fitting a two-component Gaussian mixture; examining the fitted distribution; checking calibration. Using cross-validation to select the number of components to use. Examination of the selected mixture model. Suspicious patterns in the parameters of the selected model. Approximating complicated distributions vs. revealing hidden structure. Using bootstrap hypothesis testing to select the number of mixture components.
Reading: Notes, chapter 20; mixture-examples.R
Posted by crshalizi at April 15, 2012 20:00 | permanent link
On Friday, my student Daniel McDonald, who I have been lucky enough to jointly advise with Mark Schervish, defeated the snake — that is, defended his thesis:
I hope to have a follow-up post very soon about the substance of Daniel's work, which is part of our INET grant, but in the meanwhile: congratulations, Dr. McDonald!
Posted by crshalizi at April 08, 2012 17:25 | permanent link
Posted by crshalizi at April 06, 2012 01:03 | permanent link
Attention conservation notice: 2000 words of advice to larval academics, based on mere guesswork and ill-assimilated psychology.
It being the season for job-interview talks, student exam presentations, etc., the problems novices have with giving them are much on my mind. And since I find myself composing the same e-mail of advice over and over, why not write it out once and for all?
Once you understand the purpose of academic talks, it becomes clear that the two fundamental obstacles to giving good talks are memory and fear.
The point of academic talk is to try to persuade your audience to agree with you about your research. This means that you need to raise a structure of argument in their minds, in less than an hour, using just your voice, your slides, and your body-language. Your audience, for its part, has no tools available to it but its ears, eyes, and mind. (Their phones do not, in this respect, help.)
This is a crazy way of trying to convey the intricacies of a complex argument. Without external aids like writing and reading, the mind of the East African Plains Ape has little ability to grasp, and more importantly to remember, new information. (The great psychologist George Miller estimated the number of pieces of information we can hold in short-term memory as "the magical number seven, plus or minus two", but this may if anything be an over-estimate.) Keeping in mind all the details of an academic argument would certainly exceed that slight capacity*. When you over-load your audience, they get confused and cranky, and they will either tune you out or avenge themselves on the obvious source of their discomfort, namely you.
Therefore, do not overload your audience, and do not even try to convey all the intricacies of a complex academic argument in your talk. The proper goal of an academic talk is to convey a reasonably persuasive sketch of your argument, so that your audience are better informed about the subject, get why they should care, and are usefully oriented to what you wrote if and when they decide to read your paper. In many ways a talk is really an extended oral abstract for your paper. (This is more effective if those who are interested can read your paper, at an open pre-print archive or at least on your website.) Success in this means keeping your audience's load low, and there are two big ways to do that: make it easier for them to remember what matters, and reduce what they have to remember.
People can remember things more easily if they have a scheme they can relate them to, which helps them appreciate their relevance. Your audience will come to the talk with various schemata; use them.
As for limiting the information the audience needs to remember, the main rule is to ask yourself "Do they need to know this to follow the argument?" and "Will they need to remember this later?" If they do not need to know it even for a moment, cut it. (Showing or telling them details, followed by "don't worry about the details", does not work.) If they will need to remember it later, emphasize it, and remind them when you need it.
To answer "Do they need to know this?" and "Will they have to recall this?", you need to be intimately familiar with the logic of your own talk. The ideal of such familiarity is to have that logic committed to memory — the logic, not some exact set of words. When you really understand it, when you grasp all the logical connections and see why everything that's necessary is needed, the argument can "carry you along" through the presentation, letting you compose appropriate words as you go, without rote memorization. This has many advantages, not least the ability to field questions.
As a corollary to limiting what the audience needs to remember, if you are using slides, their text should be (1) prompts for your exposition and your audience's memory, or (2) things which are just too hard to say, like equations**. (Do not, whatever you do, read aloud the text of your slides.) But whether spoken or on the slide, cut your talk down to the essentials. This requires you to know what is essential.
"But the lovely, no the divine, details!" you protest. "All those fine points I checked, all the intricate work I did, all the alternatives I ruled out? When do I get to talk about them?" To which there are several responses.
To sum up on memory, then: successful academic talks persuade your audience of your argument. To do this, and not instead alienate your audience, you have to work with their capacities and prior knowledge, and not against them. Negatively, this means limiting the amount of information you expect them to retain. Positively, you need to use, and make, schemata which help them see the relevance of particulars. You can still give an awful talk this way (maybe your argument is incredibly bad), but you can hardly give a good talk without it.
The major consideration in crafting the content of your talk is your audience's memory. The major consideration for the delivery of the talk is your fear. (Your own memory is not so great, but you have of course internalized the schema for your own talk, and so you can re-generate it as you go, using your slides as prompts.) Public speaking, especially about something important to you, and to an audience whose opinion matters to you, is intimidating to many people. Fear makes you a worse public speaker; you mumble, you forget your place in the argument, you can't think on your feet, you project insecurity (possibly by over-compensating), etc. You do not need to become a great, fearless public speaker; you do need to be adequate at it. The three major routes to doing this, in my experience, are desensitization, dissociation, and deliberate acts.
Desensitization is simple: the more you do it, and emerge unscathed, the less fearful you will be. Practice giving your talks to safe but critical audiences. ("But critical" is key: you need them to tell you honestly what wasn't working well. [Something can always be done better.]) If you can't get a safe-but-critical audience, get an audience you don't care about (e.g., some random conference), and practice on them. Remind yourself, too, that while your talk may be a big deal for you, it's rarely a big deal for your audience.
Dissociation is about embracing being a performer on a stage: the audience's idea of you is already a fictional character, so play a character. It can, once again, be very liberating to separate the persona you're adopting for the talk from the person you actually are. If that seems unethical, go read The Presentation of Self in Everyday Life. An old-fashioned insistence that what really matters are the ideas, and not their merely human vessel, can also be helpful here.
Finally, deliberate actions are partly about communicating better, and partly about a fake-it-till-you-make-it assumption of confidence. (Some of these are culture-bound, so adjust as need be.) Project your voice to be heard through the room. (Don't be ashamed to use a microphone if need be.) Look at your audience (not your shoes or the screen), letting your eyes rove over them to gauge their facial expressions; don't be afraid to maintain eye contact, but keep moving on. Maintain a nearly-conversational speed of talking; avoid long pauses. When fielding questions, don't defer to senior people or impose on your juniors; re-phrase the question before answering, to make sure everyone gets it, and to give yourself time to think about your reply. And for the sake of all that's holy, speak to the audience, not to a screen.
At the outset, I said that the two great obstacles to giving a good talk are memory and fear. The converse is that if you truly understand your own argument, and you truly believe in it, you can convey it in a way which works with your audience's memory, and overcome your own fear. The sheer mechanics of presentation will come with practice, and you will have something worth presenting.
Further reading:
*: Some branches of the humanities and the social sciences have the horrible custom of reading an academic paper out loud, apparently on the theory that this way none of the details get glossed over. The only useful advice which can be given about this is "Don't!". Academic prose has many virtues, but it is simply not designed for oral communication. Moreover, all of your audience consists of people who are very good at reading such prose, and can certainly do so at least as fast as you can recite it. Having people recite their papers, or even prepared remarks written in the style of a paper, does nothing except waste an hour in the life of the speaker and the audience — and none of us has hours to waste. ^
**: As a further corollary, and particularly important in statistics, big tables of numbers (e.g., regression coefficients) are pointless; and here "big" means "larger than 2x2". ^
Manual trackback: Rules of Reason; New APPS; Hacker News; paperpools; Nanopolitan; The Essence of Mathematics Is Its Freedom
Posted by crshalizi at April 04, 2012 01:09 | permanent link
Homework 8: in which returning to paleontology gives us an excuse to work with simulations, and to compare distributions.
Posted by crshalizi at April 03, 2012 23:40 | permanent link
Homework 8: in which we try to predict political orientation
from bumps on the skull the volume of brain regions determined
by MRI and adjusted by (unknown) formulas.
Posted by crshalizi at April 03, 2012 09:20 | permanent link
Adding noise to PCA to get a statistical model. The factor model, or linear regression with unobserved independent variables. Assumptions of the factor model. Implications of the model: observable variables are correlated only through shared factors; "tetrad equations" for one factor models, more general correlation patterns for multiple factors. Our first look at latent variables and conditional independence. Geometrically, the factor model says the data cluster on some low-dimensional plane, plus noise moving them off the plane. Estimation by heroic linear algebra; estimation by maximum likelihood. The rotation problem, and why it is unwise to reify factors. Other models which produce the same correlation patterns as factor models.
Reading: Notes, chapter 19; factors.R and sleep.txt
Posted by crshalizi at April 03, 2012 09:15 | permanent link
Principal components is the simplest, oldest and most robust of dimensionality-reduction techniques. It works by finding the line (plane, hyperplane) which passes closest, on average, to all of the data points. This is equivalent to maximizing the variance of the projection of the data on to the line/plane/hyperplane. Actually finding those principal components reduces to finding eigenvalues and eigenvectors of the sample covariance matrix. Why PCA is a data-analytic technique, and not a form of statistical inference. An example with cars. PCA with words: "latent semantic analysis"; an example with real newspaper articles. Visualization with PCA and multidimensional scaling. Cautions about PCA; the perils of reification; illustration with genetic maps.
Reading: Notes, chapter 18; pca.R, pca-examples.Rdata, and cars-fixed04.dat
Posted by crshalizi at April 03, 2012 09:10 | permanent link
Applying the right CDF to a continuous random variable makes it uniformly distributed. How do we test whether some variable is uniform? The smooth test idea, based on series expansions for the log density. Asymptotic theory of the smooth test. Choosing the basis functions for the test and its order. Smooth tests for non-uniform distributions through the transformation. Dealing with estimated parameters. Some examples. Non-parametric density estimation on [0,1]. Checking conditional distributions and calibration with smooth tests. The relative distribution idea: comparing whole distributions by seeing where one set of samples falls in another distribution. Relative density and its estimation. Illustrations of relative densities. Decomposing shifts in relative distributions.
Reading: Notes, chapter 17
Optional reading: Bera and Ghosh, "Neyman's Smooth Test and Its Applications in Econometrics"; Handcock and Morris, "Relative Distribution Methods"
Posted by crshalizi at April 03, 2012 09:00 | permanent link
Attention conservation notice: I have no taste.
Books to Read While the Algae Grow in Your Fur; Scientifiction and Fantastica; Enigmas of Chance; The Progressive Forces Central Asia; The Collective Use and Evolution of Concepts; The Commonwealth of Letters; Writing for Antiquity; Commit a Social Science; Pleasures of Detection, Portraits of Crime
Posted by crshalizi at March 31, 2012 23:59 | permanent link
From the all-too-small Department of Unambiguously Good Things Happening to People Who Thoroughly Deserve Them, Judea Pearl has won the Turing Prize for 2011. As a long-time admirer*, I could not be more pleased, and would like to take this opportunity to recommend his "Causal Inference in Statistics" again.
*: I realize this edges into "I liked Feynman before he joined the Manhattan Project; the Williamsburg Project was edgier" territory, but I have very vivid memories of reading Probabilistic Reasoning in Intelligent Systems in the winter months of early 1999, and being correspondingly excited to hear that the first edition of Causality was coming out...
Posted by crshalizi at March 30, 2012 15:30 | permanent link
Attention conservation notice: Only of interest if you (1) care about high-dimensional statistics and (2) will be in Pittsburgh over the next two weeks.
I am not sure how our distinguished speakers would feel at being called sorcerers, but since one of them is using sparsity to read minds, and the other to infer causation from correlation, it is hard to think of a more appropriate word.
As always, the talks are free and open to the public; hecklers will, however, be turned into newts.
Posted by crshalizi at March 29, 2012 13:10 | permanent link
Attention conservation notice: Only of interest if you (1) care about statistical models of networks or collective information-processing, and (2) will be in Pittsburgh this week.
I am behind in posting my talk announcements:
Enigmas of Chance; Networks; The Collective Use and Evolution of Concepts
Posted by crshalizi at March 26, 2012 10:00 | permanent link
You are a theoretical physicist, trying to do data analysis, and "Such a Shande far de Goyim!" is all I can think after reading your manuscript. Even if it turns out we are playing out this touching scene (which never fails to bring tears to my eyes) — no.
(SMBC via Lost in Transcription)
Update: Thanks to reader R.K. for correcting my Yiddish.
Posted by crshalizi at March 21, 2012 11:49 | permanent link
Homework 7: A little theory, a little methodology, a little data analysis: these keep growing young statisticians healthily balanced.
assignment, n90_pol.csv data
Posted by crshalizi at March 20, 2012 10:31 | permanent link
Simulation: implementing the story encoded in the model, step by step, to produce something data-like. Stochastic models have random components and so require some random steps. Stochastic models specified through conditional distributions are simulated by chaining together random variables. How to generate random variables with specified distributions. Simulation shows us what a model predicts (expectations, higher moments, correlations, regression functions, sampling distributions); analytical probability calculations are short-cuts for exhaustive simulation. Simulation lets us check aspects of the model: does the data look like typical simulation output? if we repeat our exploratory analysis on the simulation output, do we get the same results? Simulation-based estimation: the method of simulated moments.
Reading: Notes, chapter 16; R
Posted by crshalizi at March 20, 2012 10:30 | permanent link
My paper with Aaron Clauset and Mark Newman on power laws has just passed 1000 citations on Google Scholar, slightly ahead of schedule. (Actually, the accuracy of Aaron's prediction is a little creepy.)
I am spending the day reading over my student Daniel McDonald's dissertation draft. The calendar tells me that I was in the middle of writing up my own dissertation in mid-March 2001. But this is impossible, since I could swear that was just a few months ago at most, not eleven years.
Most significant of all, one of my questions has been answered by Guillaume the adaptationist goat.
Posted by crshalizi at March 15, 2012 11:00 | permanent link
The desirability of estimating not just conditional means, variances, etc., but whole distribution functions. Parametric maximum likelihood is a solution, if the parametric model is right. Histograms and empirical cumulative distribution functions are non-parametric ways of estimating the distribution: do they work? The Glivenko-Cantelli law on the convergence of empirical distribution functions, a.k.a. "the fundamental theorem of statistics". More on histograms: they converge on the right density, if bins keep shrinking but the number of samples per bin keeps growing. Kernel density estimation and its properties: convergence on the true density if the bandwidth shrinks at the right rate; superior performance to histograms; the curse of dimensionality again. An example with cross-country economic data. Kernels for discrete variables. Estimating conditional densities; another example with the OECD data. Some issues with likelihood, maximum likelihood, and non-parametric estimation.
Reading: Notes, chapter 15
Posted by crshalizi at March 08, 2012 10:30 | permanent link
Reminders about multivariate distributions. The multivariate Gaussian distribution: definition, relation to the univariate or scalar Gaussian distribution; effect of linear transformations on the parameters; plotting probability density contours in two dimensions; using eigenvalues and eigenvectors to understand the geometry of multivariate Gaussians; conditional distributions in multivariate Gaussians and linear regression; computational aspects, specifically in R. General methods for estimating parametric distributional models in arbitrary dimensions: moment-matching and maximum likelihood; asymptotics of maximum likelihood; bootstrapping; model comparison by cross-validation and by likelihood ratio tests; goodness of fit by the random projection trick.
Reading: Notes, chapter 14
Posted by crshalizi at March 06, 2012 09:25 | permanent link
Building a weather forecaster for Snoqualmie Falls, Wash., with logistic regression. Exploratory examination of the data. Predicting wet or dry days form the amount of precipitation the previous day. First logistic regression model. Finding predicted probabilities and confidence intervals for them. Comparison to spline smoothing and a generalized additive model. Model comparison test detects significant mis-specification. Re-specifying the model: dry days are special. The second logistic regression model and its comparison to the data. Checking the calibration of the second model.
Reading: Notes, second half of chapter 13; Faraway, chapters 6 and 7
Posted by crshalizi at March 01, 2012 10:30 | permanent link
Attention conservation notice: I have no taste.
Books to Read While the Algae Grow in Your Fur; Scientifiction and Fantastica; Pleasures of Detection, Portraits of Crime; Enigmas of Chance; Minds, Brains, and Neurons; The Commonwealth of Letters; Commit a Social Science
Posted by crshalizi at February 29, 2012 23:59 | permanent link
In which we practice our art upon the condition formerly known as juvenile diabetes.
Posted by crshalizi at February 28, 2012 10:31 | permanent link
Iteratively re-weighted least squares for logistic regression re-examined: coping with nonlinear transformations and model-dependent heteroskedasticity. The common pattern of generalized linear models and IRWLS. Binomial and Poisson regression. The extension to generalized additive models.
Reading: Notes, first half of chapter 13; Faraway, section 3.1, chapter 6
Posted by crshalizi at February 28, 2012 10:30 | permanent link
Modeling conditional probabilities; using regression to model probabilities; transforming probabilities to work better with regression; the logistic regression model; maximum likelihood; numerical maximum likelihood by Newton's method and by iteratively re-weighted least squares; comparing logistic regression to logistic-additive models.
Reading: Notes, chapter 12; Faraway, chapter 2 (skipping sections 2.11 and 2.12)
Posted by crshalizi at February 23, 2012 10:30 | permanent link
In which we examine the fate of the organized working class, by way of review for the midterm.
Assignment, strikes.csv data set
Posted by crshalizi at February 21, 2012 10:30 | permanent link
Attention conservation notice: Intellectuals gathering in Berkeley to argue about "knowledge" and "revolution".
This looks like fun, and if I didn't have conflicting obligations I'd definitely be there.
From Data to Knowledge: Machine-Learning with Real-time & Streaming Applications
May 7-11 2012
On the Campus of the University of California, BerkeleyWe are experiencing a revolution in the capacity to quickly collect and transport large amounts of data. Not only has this revolution changed the means by which we store and access this data, but has also caused a fundamental transformation in the methods and algorithms that we use to extract knowledge from data. In scientific fields as diverse as climatology, medical science, astrophysics, particle physics, computer vision, and computational finance, massive streaming data sets have sparked innovation in methodologies for knowledge discovery in data streams. Cutting-edge methodology for streaming data has come from a number of diverse directions, from on-line learning, randomized linear algebra and approximate methods, to distributed optimization methodology for cloud computing, to multi-class classification problems in the presence of noisy and spurious data.
This conference will bring together researchers from applied mathematics and several diverse scientific fields to discuss the current state of the art and open research questions in streaming data and real-time machine learning. The conference will be domain driven, with talks focusing on well-defined areas of application and describing the techniques and algorithms necessary to address the current and future challenges in the field.
Sessions will be accessible to a broad audience and will have a single track format with additional rooms for breakout sessions and posters. There will be no formal conference proceedings, but conference applicants are encouraged to submit an abstract and present a talk and/or poster.
See the conference page for submission details, schedules, etc.
Via conference organizer and CMU alumnus Joey Richards.
Posted by crshalizi at February 19, 2012 12:44 | permanent link
Attention conservation notice: Only of interest if you (1) like hearing people talk about statistics and machine learning, and (2) will be in Pittsburgh next week.
I have been remiss about advertising upcoming talks.
As always, the talks are free and open to the public.
(You see why I have trouble keeping up with these.)
Posted by crshalizi at February 19, 2012 12:30 | permanent link
In which extinct charismatic megafauna give us an excuse to practice basic programming, bootstrapping, and specification testing.
Posted by crshalizi at February 15, 2012 14:15 | permanent link
Non-parametric smoothers can be used to test parametric models. Forms of tests: differences in in-sample performance; differences in generalization performance; whether the parametric model's residuals have expectation zero everywhere. Constructing a test statistic based on in-sample performance. Using bootstrapping from the parametric model to find the null distribution of the test statistic. An example where the parametric model is correctly specified, and one where it is not. Cautions on the interpretation of goodness-of-fit tests. Why use parametric models at all? Answers: speed of convergence when correctly specified; and the scientific interpretation of parameters, if the model actually comes from a scientific theory. Mis-specified parametric models can predict better, at small sample sizes, than either correctly-specified parametric models or non-parametric smoothers, because of their favorable bias-variance characteristics; an example.
Reading: Notes, chapter 10
Posted by crshalizi at February 15, 2012 14:10 | permanent link
A change to the lecture schedule, by popular demand!
R programs are built around functions: pieces of code that take inputs or arguments, do calculations on them, and give back outputs or return values. The most basic use of a function is to encapsulate something we've done in the terminal, so we can repeat it, or make it more flexible. To assure ourselves that the function does what we want it to do, we subject it to sanity-checks, or "write tests". To make functions more flexible, we use control structures, so that the calculation done, and not just the result, depends on the argument. R functions can call other functions; this lets us break complex problems into simpler steps, passing partial results between functions. Programs inevitably have bugs: debugging is the cycle of figuring out what the bug is, finding where it is in your code, and fixing it. Good programming habits make debugging easier, as do some tricks. Avoiding iteration. Re-writing code to avoid mistakes and confusion, to be clearer, and to be more flexible.
Reading: Notes, chapter 9
Optional reading: Slides from 36-350, introduction to statistical computing, especially through lecture 15.
R for in-class demos (based around the previous problem set)
Posted by crshalizi at February 15, 2012 14:05 | permanent link
Attention conservation notice: Academics with blogs quibbling about obscure corners of applied statistics.
Lurkers in e-mail point me to this pushback against the general pushback against power laws, and ask me to comment. It might be a mistake to do so, but I'm feeling under the weather and so splenetic, so I will.
In our paper, we looked at 24 quantities which people claimed showed power law distributions. Of these, there were seven cases where we could flat-out reject a power law, without even having to consider an alternative, because the departures of the actual distribution from even the best-fitting power law was much too large to be explained away as fluctuations. (One of the wonderful thing about a stochastic model is that it tells you how big its own errors should be.) In contrast, there was only one data set where we could rule out the log-normal distribution.
In some of those cases, you can patch things up, sort of, by replacing a pure power law with a power-law with an exponential cut-off. That is, rather than the probability density being proportional to x-a, it's proportional to x-ae-x/L. (Either way, I am only talking about the probability density in the "right tail", i.e., for x above some xmin.) This gives the infamous straight-ish patch on a log-log plot, for values of x much smaller than L, but otherwise it has substantially different properties. In ten of the twelve cases we looked at, the only way to save the idea of a power-law at all is to include this exponential cut-off. But that exponentially-shrinking factor is precisely what squelches the WTF, X IS ELEVENTY TIMES LARGER THAN EVER! THE BIG ONE IS IN OUR BASE KILLING OUR DOODZ!!!!1!! mega-events. There were ten more cases where we judged the support for power laws as "moderate", meaning "the power law is a good fit but that there are other plausible alternatives as well" (pardon the self-quotation.) Again, those alternatives, like log-normals and stretched exponentials, give very different tail-behavior, with not so much OMG DOOM.
We found exactly one case where the statistical evidence for the power-law was "good", meaning that "the power law is a good fit and that none of the alternatives considered is plausible", which was Zipf's law of word frequency distributions. We were of course aware that when people claim there are power laws, they usually only mean that the tail follows a power law. This is why all these comparisons were about how well the different distributions fit the tail, excluding the body of the data. We even selected where "the tail" begins to maximize the fit to a power law for each case. Even so, there was just this one case where the data compelling support a power law tail.
(All of this — the meaning of "with cut-off", the meaning of our categorizations, the fact that we only compare the tails, etc. — is clear enough from our paper, if you actually read the text. Or even just the tables and their captions.)
I bring up the OMG DOOM because some people, Hanson very much included, like to extrapolate from supposed power laws for various Bad Things to scenarios where THE BIG ONE kills off most of humanity. But, at least with the data we found, the magnitudes of forest fires, solar flares, earthquakes and wars were all better fit by log-normals, by stretched exponentials and by cut-off power laws than by power laws. For fires, flares and quakes, the differences are large enough that they clearly fall into the "with cut-off only" category. The differences in fits for the war-death data are smaller, as (mercifully) is the sample size, so we put it in the "moderate" support category. If you had some compelling other reason to insist on a power law rather than (e.g.) a log-normal there, the data wouldn't slap you down, but they wouldn't back you up either.
Now, I relish the schadenfreude-laden flavors of a mega-disaster scenario as much as the next misanthropic, science-fiction-loving geek, especially when it's paired with some "The fools! Can't they follow simple math?" on the side. Truly, I do. But squeezing that savory, juicy DOOM out of (for instance) the distribution of solar flares relies on the shape of the tail, i.e., whether it's a pure power law or not. The weak support, in the data, for such powers law means you don't really have empirical evidence for your scenarios, and in some cases what evidence there is tells against them. It's a free country, so you can go on telling those stories, but don't pretend that they owe more to confronting hard truths than to literary traditions.
Posted by crshalizi at February 15, 2012 14:00 | permanent link
Attention conservation notice: 1500 word pedagogical-statistical rant, with sarcasm, mathematical symbols, computer code, and a morally dubious affectation of detachment from the human suffering behind the numbers. Plus the pictures are boring.
Does anyone know when the correlation coefficient is useful, as opposed to when it is used? If so, why not tell us?
— Tukey (1954: 721)
If you have taken any sort of statistics class at all, you have probably been exposed to the idea of the "proportion of variance explained" by a regression, conventionally written R2. This has two definitions, which happen to coincide for linear models fit by least squares. The first is to take the correlation between the model's predictions and the actual values (R) and square it (R2), getting a number which is guaranteed to be between 0 and 1. You get 1 only when the predictions are perfectly correlated with reality, and 0 when there is no linear relationship between them. The other definition is the ratio of the variance of the predictions to the variance of the actual values. It is this latter which leads to the notion that R2 is the proportion of variance explained by the model.
The use of the word "explained" here is quite unsupported and often actively misleading. Let me go over some examples to indicate why.
Start by supposing that a linear model is true:
Well, no. The answer depends on the variance of X, which it will be convenient to call v. The variance of the predictions is b2 v, but the variance of Y is larger, b2 v + s. The ratio is \[ R^2 = \frac{b^2 v}{b^2v + s} \] (You can check that this is also the squared correlation between the predictions and Y.) As v shrinks, this tends 0/s = 0. As v grows, this tends to 1. The relationship between X and Y doesn't change, the accuracy and precision with which Y can be predicted from X do not change, but R2 can wander all through its range, just depending on how dispersed X is.
Now, you say, this is a silly algebraic curiosity. Never mind the Good Fairy of Statistical Modeling handing us the correct parameters, let's talk about something gritty and real, like death in Chicago.
![]() |
Number of deaths each day in Chicago, 1 January 1987--31 December 2000, from all causes except accidents. (Click this and all later figures for larger PDF versions. See below for link to code.) |
I can relate deaths to time in any number of ways; the next figure shows what I get when I use a smoothing spline (and use cross-validation to pick how much smoothing to do). The statistical model is
![]() |
As before, but with the addition of a smoothing spline. |
The root-mean-square error of the smoothing spline is just above 12 deaths/day. The R2 of the fit is either 0.35 (squared correlation between predicted and actual deaths) or 0.33 (variance of predicted deaths over variance of actual deaths). It seems absurd, however, to say that the date explains how many people died in Chicago on a given day, or even the variation from day to day. The closest I can come up with to an example of someone making such a claim would be an astrologer, and even one of them would work in some patter about the planets and their influences. (Numerologists, maybe? I dunno.)
Worse is to follow. The same data set which gives me these values for Chicago includes other variables, such as the concentration of various atmospheric pollutants and temperature. I can fit an additive model, which tries to tease out the separate relationships between each of those variables and deaths in Chicago, without presuming a particular functional form for each relationship. In particular I can try the model
The R2 of this model is 0.27. Is this "variance explained"? Well, it's at least not incomprehensible to talk about changes in temperature or pollution explaining changes in mortality. In fact, adding this model's predictions to the simple spline's, we see that most of what the spline predicted from the date is predictable from pollution and temperature:
![]() |
Black dots: actual death counts. Red curve: spline smoothing on the date alone. Blue lines: predictions from the temperature-and-pollution model. |
We could, in fact, try to include the date in this larger model:
|
|
Despite the lack of visual drama, putting a smooth function of time back into the model increases R2, from 0.27 to 0.30. Formally, the date enters into the model in exactly the same way as particulate pollution. But, again, only a fortune teller — an unusually numerate fortunate teller, perhaps a subscriber to the Journal of Evidence-Based Haruspicy — would say that the date explains, or helps explain, 3% of the variance.
I hope that by this point you will at least hesitate to think or talk about R2 as "the proportion of variance explained". (I will not insist on your never talking that way, because you might need to speak to the deluded in terms they understand.) How then should you think about it? I would suggest: the proportion of variance retained, or just kept, by the predictions. Linear regression is a smoothing method. (It just smoothes everything on to a line, or more generally a hyperplane.) It's hard for any smoother to give fitted values which have more variance than the variable it is smoothing. R2is merely the fraction of the target's variance which is not smoothed away.
This of course raises the question of why you'd care about this number at all. If prediction is your goal, then it would seem much more natural to look at mean squared error. (Or really root mean squared error, so it's in the same units as the variable predicted.) Or mean absolute error. Or median absolute error. Or a genuine loss function. If on the other hand you want to get some function right, then your question is really about mis-specification, and/or confidence sets of functions, and not about whether your smoother is following every last wiggle of the data at all. If you want an explanation, the fact that there is a peak in deaths every year of about the same height, but the predictions fall short of it, suggests that this model is missing something. The fact that the data shows something awful happened in 1995 and the model has nothing adequate to say about it suggests that whatever's missing is very important.
Code for reproducing the figures and analyses in R. (I make this public, despite the similarity of this exercise to the last problem-set in advanced data analysis, because (i) it's not exactly the same, (ii) the homework is due in ten hours, (iii) none of my students would dream of copying this and turning it in as their own, and (iv) I borrowed the example from Simon Wood's Generalized Additive Models.)
Manual trackback: Bob O'Hara; Siris
Posted by crshalizi at February 13, 2012 23:54 | permanent link
1. I'd like to say that you have no idea how long I have waited to read something like this piece by Michael Stumpf and Mason Porter in one of the glossy journals. But that would be a lie, because if you've been reading this for any length of time, you know that the answer is, long enough to be very tiresome about it. If the referees, and still more the editors, at those journals can be persuaded to pay attention, we will be on track for my mid-2007 hope that "in five to ten years even science journalists and editors of Wired will begin to get the message." (I never really had any hopes for Wired.)
2. You can imagine how my heart sank to see that Krugman had a post titled "The Power (Law) of Twitter" — and my relief to see that he's not actually saying that the distribution of followers is a power law. It is however interesting that the distribution is so close to a log-normal.
3. My ex-boss and mentor Melanie Mitchell has a blog, and promises a substantive series of posts on power laws and scaling. In the meanwhile, go read her book.
Update, 15 February: see later post.
Manual trackback: Brendan O'Connor
(Nos. 1 and 2 via too many to list.)
Posted by crshalizi at February 13, 2012 20:40 | permanent link
The "curse of dimensionality" limits the usefulness of fully non-parametric regression in problems with many variables: bias remains under control, but variance grows rapidly with dimensionality. Parametric models do not have this problem, but have bias and do not let us discover anything about the true function. Structured or constrained non-parametric regression compromises, by adding some bias so as to reduce variance. Additive models are an example, where each input variable has a "partial response function", which add together to get the total regression function; the partial response functions are unconstrained. This generalizes linear models but still evades the curse of dimensionality. Fitting additive models is done iteratively, starting with some initial guess about each partial response function and then doing one-dimensional smoothing, so that the guesses correct each other until a self-consistent solution is reached. Examples in R using the California house-price data. Conclusion: there are no statistical reasons to prefer linear models to additive models, hardly any scientific reasons, and increasingly few computational ones; the continued thoughtless use of linear regression is a scandal.
Reading: Notes, chapter 8; Faraway, chapter 12
Posted by crshalizi at February 09, 2012 10:30 | permanent link
In which spline regression becomes a matter of life and death in Chicago.
Posted by crshalizi at February 07, 2012 10:31 | permanent link
Kernel regression controls the amount of smoothing indirectly by bandwidth; why not control the irregularity of the smoothed curve directly? The spline smoothing problem is a penalized least squares problem: minimize mean squared error, plus a penalty term proportional to average curvature of the function over space. The solution is always a continuous piecewise cubic polynomial, with continuous first and second derivatives. Altering the strength of the penalty moves along a bias-variance trade-off, from pure OLS at one extreme to pure interpolation at the other; changing the strength of the penalty is equivalent to minimizing the mean squared error under a constraint on the average curvature. To ensure consistency, the penalty/constraint should weaken as the data grows; the appropriate size is selected by cross-validation. An example with the data, including confidence bands. Writing splines as basis functions, and fitting as least squares on transformations of the data, plus a regularization term. A brief look at splines in multiple dimensions. Splines versus kernel regression.
Reading: Notes, chapter 7; Faraway, section 11.2.
Posted by crshalizi at February 07, 2012 10:30 | permanent link
Weighted least squares estimates. Heteroskedasticity and the problems it causes for inference. How weighted least squares gets around the problems of heteroskedasticity, if we know the variance function. Estimating the variance function from regression residuals. An iterative method for estimating the regression function and the variance function together. Locally constant and locally linear modeling. Lowess.
Reading: Notes, chapter 6; Faraway, section 11.3.
Posted by crshalizi at February 02, 2012 10:30 | permanent link
Attention conservation notice: I have no taste.
The IdiadShall I write a poem about you
And your epic struggle against stupidity?
Feh. But if the brain is a city
I too have rooms in the swampy part, surrounded by crocodiles.
The monarch butterflies sail down from the Canadian Rockies
To overwinter in Pacific Grove, pair off and fly away;
They bruise me. I get crankier.
If you are coming down through the narrows of the Saugatuck
Please text me beforehand,
And I will come out to meet you
As far as Palookaville.
Posted by crshalizi at January 31, 2012 23:59 | permanent link
In which we consider evolutionary trends in body size, aided by regression modeling and the bootstrap.
Posted by crshalizi at January 31, 2012 19:11 | permanent link
Quantifying uncertainty by looking at sampling distributions. The bootstrap principle: sampling distributions under a good estimate of the truth are close to the true sampling distributions. Parametric bootstrapping. Non-parametric bootstrapping. Many examples. When does the bootstrap fail?
Reading: Notes, chapter 5 (R for figures and examples; pareto.R; wealth.dat); R for in-class examples
Posted by crshalizi at January 31, 2012 19:10 | permanent link
Fortunately, however, the methods of those who can handle big data are neither grotesque nor incomprehensible, and we will hear about them on Monday.
As always, the talk is free and open to the public.
Posted by crshalizi at January 31, 2012 19:00 | permanent link
Attention conservation notice: Only of interest if you (1) care about combinatorial stochastic processes and their statistical applications, and (2) will be in Pittsburgh on Wednesday afternoon.
It is only in very special weeks, when we have been very good, that we get two seminars.
As always, the talk is free and open to the public.
Posted by crshalizi at January 31, 2012 18:45 | permanent link
Attention conservation notice: Associate editor at a non-profit scientific journal endorses a call for boycotting a for-profit scientific journal publisher.
I have for years been refusing to publish in or referee for journals publisher by Elsevier; pretty much all of the commercial journal publishers are bad deals1, but they are outrageously worse than most. Since learning that Elsevier had a business line in putting out publications designed to look like peer-reviewed journals, and calling themselves journals, but actually full of paid-for BS, I have had a form letter I use for declining requests to referee, letting editors know about this, and inviting them to switch to a publisher which doesn't deliberately seek to profit by corrupting the process of scientific communication.
I am thus extremely happy to learn from Michael Nielsen that Tim Gowers is organizing a general boycott of Elsevier, asking people to pledge not to contribute to its journals, referee for them, or do editorial work for them. You can sign up here, and I strongly encourage you to do so. There are fields where Elsevier does publish the leading journals, and where this sort of boycott would be rather more personally costly than it is in statistics, but there is precedent for fixing that. Once again, I strongly encourage readers in academia to join this.
(To head off the inevitable mis-understandings, I am not, today, calling for getting rid of journals as we know them. I am saying that Elsevier is ripping us off outrageously, that conventional journals can be published without ripping us off, and so we should not help Elsevier to rip us off.)
Disclaimer, added 29 January: As I should have thought went without saying, I am speaking purely for myself here, and not with any kind of institutional voice. In particular, I am not speaking for the Annals of Applied Statistics, or for the IMS, which publishes it. (Though if the IMS asked its members to join in boycotting Elsevier, I would be very happy.)
1: Let's review how scientific journals work, shall we? Scientists are not paid by journals to write papers: we do that as volunteer work, or more exactly, part of the money we get for teaching and from research grants is supposed to pay for us to write papers. (We all have day-jobs.) Journals are edited by scientists, who volunteer for this and get nothing from the publisher. (New editors get recruited by old editors.) Editors ask other scientists to referee the submissions; the referees are volunteers, and get nothing from the publisher (or editor). Accepted papers are typeset by the authors, who usually have to provide "camera-ready" copy. The journal publisher typically provides an electronic system for keeping track of submitted manuscripts and the refereeing process. Some of them also provide a minimal amount of copy-editing on accepted papers, of dubious value. Finally, the publisher actually prints the journal, and runs the server distributing the electronic version of the paper, which is how, in this day and age, most scientists read it. While the publisher's contribution isn't nothing, it's also completely out of proportion to the fees they charge, let alone economically efficient pricing. The whole thing would grind to a halt without the work done by scientists, as authors, editors and referees. That work, to repeat, is paid for either by our students or by our grants, not by the publisher. This makes the whole system of for-profit journal publication economically insane, a check on the dissemination of knowledge which does nothing to encourage its creation. Elsevier is simply one of the worst of these parasites.
Manual trackback: Cosmic Variance; Open A Vein; AgroEcoPeople; QED Insight
Posted by crshalizi at January 28, 2012 11:15 | permanent link
Attention conservation notice: Only of interest if you (1) care about covariance matrices and (2) will be in Pittsburgh on Monday.
Since so much of multivariate statistics depends on patterns of correlation among variables, it is a bit awkward to have to admit that in lots of practical contexts, correlations matrices are just not very stable, and can change quite drastically. (Some people pay a lot to rediscover this.) It turns out that there are more constructive responses to this situation than throwing up one's hands and saying "that sucks", and on Monday a friend of the department and general brilliant-type-person will be kind enough to tell us about them:
As always, the talk is free and open to the public.
Posted by crshalizi at January 27, 2012 14:25 | permanent link
The constructive alternative to complaining about linear regression is non-parametric regression. There are many ways to do this, but we will focus on the conceptually simplest one, which is smoothing; especially kernel smoothing. All smoothers involve local averaging of the training data. The bias-variance trade-off tells us that there is an optimal amount of smoothing, which depends both on how rough the true regression curve is, and on how much data we have; we should smooth less as we get more information about the true curve. Knowing the truly optimal amount of smoothing is impossible, but we can use cross-validation to select a good degree of smoothing, and adapt to the unknown roughness of the true curve. Detailed examples. Analysis o how quickly kernel regression converges on the truth. Using smoothing to automatically discover interactions. Plots to help interpret multivariate smoothing results. Average predictive comparisons.
Readings: Notes, chapter 4 (R); Faraway, section 11.1
Optional readings: Hayfield and Racine, "Nonparametric Econometrics: The np Package"; Gelman and Pardoe, "Average Predictive Comparisons for Models with Nonlinearity, Interactions, and Variance Components" [PDF]
Posted by crshalizi at January 26, 2012 10:30 | permanent link
In which we try to discern whether poor countries grow faster.
Posted by crshalizi at January 26, 2012 09:30 | permanent link
Goals of statistical analysis: summaries, prediction, scientific inference. Evaluating predictions: in-sample error, generalization error; over-fitting. Cross-validation for estimating generalization error and for model selection. Justifying model-based inferences; Luther and Süleyman.
Reading: Notes, chapter 3 (R for examples and figures).
Posted by crshalizi at January 24, 2012 10:30 | permanent link
Multiple linear regression: general formula for the optimal linear predictor. Using Taylor's theorem to justify linear regression locally. Collinearity. Consistency of ordinary least squares estimates under weak conditions. Linear regression coefficients will change with the distribution of the input variables: examples. Why R2 is usually a distraction. Linear regression coefficients will change with the distribution of unobserved variables (omitted variable problems). Errors in variables. Transformations of inputs and of outputs. Utility of probabilistic assumptions; the importance of looking at the residuals. What "controlled for in a linear regression" really means.
Reading: Notes, chapter 2 (R for examples and figures); Faraway, chapter 1 (continued).
Posted by crshalizi at January 24, 2012 10:15 | permanent link
Attention conservation notice: A silly idea about gamifying credit cards, which would be evil if it worked.
To make a profit in an otherwise competitive industry, it helps if you can impose switching costs on your customers, making them either pay to stop doing business with you, or give up something of value to them. There are whole books about this, written by respected economists1.
This is why credit card companies are happy to offer rewards for use: accumulating points on a card, which would not move with you if you got a new card and transferred the balance, is an attempt to create switching costs. Unfortunately, from the point of view of the banks, people will redeem their points from time to time, so some money must be spent on the rewards. The ideal would be points which people would value but which would never cost the bank anything.
Item: Computer games are, deliberately, addictive. Social games are especially addictive.
Accordingly, if I were an evil and unscrupulous credit card company (but I repeat myself), I would create an online game, where people could get points either from playing the game, or from spending money with my credit card. For legal reasons, I think it would probably be best to allow the game to technically be open to everyone, but with a registration fee which is, naturally, waived for card-holders. Of course, the game software would be set up to announce on Facebook (etc.) whenever the player/debtor leveled up. I would also be tempted to award double points for fees, and triple for interest charges, but one could experiment with this. If they close their credit card account, they have to start the game over from the beginning.
The fact that online acquaintances can't tell whether the debtor is advancing through spending or through game-play helps keep the reward points worth having. It's true that the credit card company has to pay for the game's design (a one-time start-up cost) and the game servers, but these are fairly cheap, and the bank never has to cash out points in actual dollars or goods. The debtors themselves do all the work of investing the points with meaning and value. They impose the switching costs on themselves.
My plan is sheer elegance in its simplicity, and I will be speaking to an attorney about a business method patent first thing Monday.
1: Much can be learned about our benevolent new-media overlords from the fact that this book carries a blurb from Jeff Bezos of Amazon, and that Varian now works for Google.
Posted by crshalizi at January 22, 2012 10:15 | permanent link
Attention conservation notice: An academic paper you've never heard of, about a distressing subject, had bad statistics and is generally foolish.
Because my so-called friends like to torment me, several of them made sure that I knew a remarkably idiotic paper about power laws was making the rounds, promoted by the ignorant and credulous, with assistance from the credulous and ignorant, supported by capitalist tools:
Let's see if we can't stop this before it gets too far, shall we? The serial killer in question is one Andrei Chikatilo, and that Wikipedia article gives the dates of death of his victims, which seems to have been Simkin and Roychowdhury's data source as well. Several of these are known only imprecisely, so I made guesses within the known ranges; the results don't seem to be very sensitive to the guesses. Simkin and Roychowdhury plotted the distribution of days between killings in a binned histogram on a logarithmic scale; as we've explained elsewhere, this is a bad idea, which destroys information to no good purpose, and a better display is shows the (upper or complementary) cumulative distribution function1, which looks like so:
When I fit a power law to this by maximum likelihood, I get an exponent of 1.4, like Simkin and Roychowdhury; that looks like this:
On the other hand, when I fit a log-normal (because Gauss is not mocked), we get this:
After that figure, a formal statistical test is almost superfluous, but let's do it anyway, because why just trust our eyes when we can calculate? The data are better fit by the log-normal than by the power-law (the data are e10.41 or about 33 thousand times more likely under the former than the latter), but that could happen via mere chance fluctuations, even when the power law is right. Vuong's model comparison test lets us quantify that probability, and tells us a power-law would produce data which seems to fit a log-normal this well no more than 0.4 percent2 of the time. Not only does the log-normal distribution fit better than the power-law, the difference is so big that it would be absurd to try to explain it away as bad luck. In absolute terms, we can find the probability of getting as big a deviation between the fitted power law and the observed distribution through sampling fluctuations, and it's about 0.03 percent2b [R code for figures, estimates and test, including data.]
Since Simkin and Roychowdhury's model produces a power law, and these data, whatever else one might say about them, are not power-law distributed, I will refrain from discussing all the ways in which it is a bad model. I will re-iterate that it is an idiotic paper — which is different from saying that Simkin and Roychowdhury are idiots; they are not and have done interesting work on, e.g., estimating how often references are copied from bibliographies without being read by tracking citation errors4. But the idiocy in this paper goes beyond statistical incompetence. The model used here was originally proposed for the time intervals between epileptic fits. The authors realize that
[i]t may seem unreasonable to use the same model to describe an epileptic and a serial killer. However, Lombroso [5] long ago pointed out a link between epilepsy and criminality.That would be the 19th-century pseudo-scientist3 Cesare Lombroso, who also thought he could identify criminals from the shape of their skulls; for "pointed out", read "made up". Like I said: idiocy.
As for the general issues about power laws and their abuse, say something once, why say it again?
Update 9 pm that day: Added the goodness-of-fit test (text
before note 2b, plus that note), updated code, added PNG versions of figures,
added attention conservation notice.
21 January: typo fixes (missing pronoun, mis-placed decimal point), added
bootstrap confidence interval for exponent, updated code accordingly.
Manual trackback: Hacker News (do I really need to link to this?), Naked Capitalism (?!); Mathbabe; Wolfgang Beirl; Ars Mathematica (yes, I am that predictable); Improbable Research (I am not worthy)
1: This is often called the "survival function", but that seems inappropriate here.
2: On average, the log-likelihood of each observation was 0.20 higher under the log-normal than under the power law, and the standard deviation of the log likelihood ratio over the samples was only 0.54. The test statistic thus comes out to -2.68, and the one-sided p-value to 0.36%.
2b: Use a Kolmogorov-Smirnov test. Since the power law has a parameter estimated from data (namely, the exponent), we can't just plug in to the usual tables for a K-S test, but we can find a p-value by simulating the power law (as in my paper with Aaron and Mark), and when I do that, with a hundred thousand replications, the p-value is about 3*10-4.
3: There are in fact subtle, not to say profound, issues in the sociology and philosophy of science here: was Lombroso always a pseudo-scientist, because his investigations never came up to any acceptable standard of reliable inquiry? Or just because they didn't come up to the standards of inquiry prevalent at the time he wrote? Or did Lombroso become a pseudo-scientist, when enough members of enough intellectual communities woke up from the pleasure of having their prejudices about the lower orders echoed to realize that he was full of it? However that may be, this paper has the dubious privilege of being the first time I have ever seen Lombroso cited as an authority rather than a specimen.
4: Actually, for several years my bibliography data base had the wrong page numbers for one of my own papers, due to a typo, so their method would flag some of my subsequent works as written by someone who had cited that paper without reading it, which I assure you was not the case. But the idea seems reasonable in general.
Posted by crshalizi at January 17, 2012 20:23 | permanent link
In which we practice the art of linear regression upon the California real-estate market, by way of warming up for harder tasks.
(Yes, the data set is now about as old as my students, but last week in
Austin I was too busy drinking on 6th street having lofty
conversations about the future of statistics to update the file with
the UScensus2000
package.)
Posted by crshalizi at January 17, 2012 10:31 | permanent link
Statistics is the science which studies methods for learning from imperfect data. Regression is a statistical model of functional relationships between variables. Getting relationships right means being able to predict well. The least-squares optimal prediction is the expectation value; the conditional expectation function is the regression function. The regression function must be estimated from data; the bias-variance trade-off controls this estimation. Ordinary least squares revisited as a smoothing method. Other linear smoothers: nearest-neighbor averaging, kernel-weighted averaging.
Readings: Notes, chapter 1; Faraway, chapter 1, through page 17.
Posted by crshalizi at January 17, 2012 10:30 | permanent link
If you sent me e-mail at my @stat.cmu.edu address in the last few days, I haven't gotten it, and may never get it. The address firstinitiallastname at cmu dot edu now points somewhere where I can read.
Posted by crshalizi at January 07, 2012 20:40 | permanent link
I'll be speaking at UT-Austin next week, through the kindness of the division of statistics and scientific computation:
This will of course be based on my paper with Alessandro, but since I understand some non-statisticians may sneak in, I'll try to be more comprehensible and less technical.
Since this will be my first time in Austin (indeed my first time in Texas), and I have (for a wonder) absolutely no obligations on the 12th, suggestions on what I should see or do would be appreciated.
Posted by crshalizi at January 06, 2012 14:15 | permanent link
It's that time again:
Fuller details on the class homepage, including a detailed (but subject to change) list of topics, and links to the compiled course notes. I'll post updates here to the notes for specific lectures and assignments, like last time.
This is the same course I taught last spring, only grown from sixty-odd students to (currently) ninety-three (from 12 different majors!). The smart thing for me to do would probably be to change nothing (I haven't gotten to re-teach a class since 2009), but I felt the urge to re-organize the material and squeeze in a few more topics.
The biggest change I am making is introducing some quality-control sampling. The course is to big for me to look over much of the students' work, and even then, that gives me little sense of whether the assignments are really probing what they know (much less helping them learn). So I will be randomly selecting six students every week, to come to my office and spend 10--15 minutes each explaining the assignment to me and answering live questions about it. Even allowing for students being randomly selected multiple times*, I hope this will give me a reasonable cross-section of how well the assignments are working, and how well the grading tracks that. But it's an experiment and we'll see how it goes.
* (exercise for the student): Find the probability distribution of the number of times any given student gets selected. Assume 93 students, with 6 students selected per week, and 14 weeks. (Also assume no one drops the class.) Find the distribution of the total number of distinct students who ever get selected.
Posted by crshalizi at January 03, 2012 23:00 | permanent link
Attention conservation notice: Navel-gazing.
Paper manuscripts completed: 12
Papers accepted: 2 [i, ii], one from last year
Papers rejected: 10 (fools! I'll show you all!)
Papers rejected with a comment from the editor that no one should take the
paper I was responding to, published in the same glossy high-impact journal,
"literally": 1
Papers in refereeing limbo: 4
Papers in progress: I won't look in that directory and you can't make me
Grant proposals submitted: 3
Grant proposals rejected: 4 (two from last year)
Grant proposals in refereeing limbo: 1
Grant proposals in progress for next year: 3
Talk given and conferences attended: 20, in 14 cities
Manuscripts refereed: 46, for 18 different journals and conferences
Manuscripts waiting for me to referee: 7
Manuscripts for which I was the responsible associate editor
at Annals of Applied
Statistics: 10
Book proposals reviewed: 3
Classes taught: 2
New classes taught: 2
Summer school classes taught: 1
New summer school classes taught: 1
Pages of new course material written: about 350
Students who are now ABD: 1
Students who are not just ABD but on the job market: 1
Letters of recommendation written: 8 (with about 100 separate destinations)
Promotion packets submitted: 1 (for promotion to associate professor, but without tenure)
Promotion cases still working through the system: 1
Book reviews published on dead trees: 2 [i, ii]
Non-book-reviews published on dead trees: 1
Weblog posts: 157
Substantive weblog posts: 54, counting algal
growths
Books acquired: 298
E-book readers gratefully received: 1
Books driven by my mother from her house to Pittsburgh: about 800
Books begun: 254
Books finished: 204 (of which 34 on said e-book reader)
Books given up: 16
Books sold: 133
Books donated: 113
Book manuscripts completed: 0
Wisdom teeth removed: 4
Unwise teeth removed: 1
Major life transitions: 0
Posted by crshalizi at January 01, 2012 12:00 | permanent link